Immigrants from Scotland vs Immigrants from Western Europe Single Father Households

COMPARE

Immigrants from Scotland
Race
Ancestry
AfghanAfricanAlaska NativeAlaskan AthabascanAlbanianAleutAlsatianAmericanApacheArabArapahoArgentineanArmenianAssyrian/Chaldean/SyriacAustralianAustrianBahamianBangladeshiBarbadianBasqueBelgianBelizeanBermudanBhutaneseBlackfeetBolivianBrazilianBritishBritish West IndianBulgarianBurmeseCajunCambodianCanadianCape VerdeanCarpatho RusynCelticCentral AmericanCentral American IndianCherokeeCheyenneChickasawChileanChineseChippewaChoctawColombianColvilleComancheCosta RicanCreeCreekCroatianCrowCubanCypriotCzechCzechoslovakianDanishDelawareDominicanDutchDutch West IndianEastern EuropeanEcuadorianEgyptianEnglishEstonianEthiopianEuropeanFijianFilipinoFinnishFrenchFrench American IndianFrench CanadianGermanGerman RussianGhanaianGreekGuamanian/ChamorroGuatemalanGuyaneseHaitianHmongHonduranHopiHoumaHungarianIcelanderIndian (Asian)IndonesianInupiatIranianIraqiIrishIroquoisIsraeliItalianJamaicanJapaneseJordanianKenyanKiowaKoreanLaotianLatvianLebaneseLiberianLithuanianLumbeeLuxembourgerMacedonianMalaysianMalteseMarshalleseMenomineeMexicanMexican American IndianMongolianMoroccanNative HawaiianNavajoNepaleseNew ZealanderNicaraguanNigerianNorthern EuropeanNorwegianOkinawanOsageOttawaPaiutePakistaniPalestinianPanamanianParaguayanPennsylvania GermanPeruvianPimaPolishPortuguesePotawatomiPuebloPuerto RicanPuget Sound SalishRomanianRussianSalvadoranSamoanScandinavianScotch-IrishScottishSeminoleSenegaleseSerbianShoshoneSierra LeoneanSiouxSlavicSlovakSloveneSomaliSouth AfricanSouth AmericanSouth American IndianSoviet UnionSpaniardSpanishSpanish AmericanSpanish American IndianSri LankanSubsaharan AfricanSudaneseSwedishSwissSyrianTaiwaneseThaiTlingit-HaidaTohono O'OdhamTonganTrinidadian and TobagonianTsimshianTurkishU.S. Virgin IslanderUgandanUkrainianUruguayanUteVenezuelanVietnameseWelshWest IndianYakamaYaquiYugoslavianYumanYup'ikZimbabwean
Immigration
NonimmigrantsImmigrantsAfghanistanAfricaAlbaniaArgentinaArmeniaAsiaAustraliaAustriaBahamasBangladeshBarbadosBelarusBelgiumBelizeBoliviaBosnia and HerzegovinaBrazilBulgariaBurma/MyanmarCabo VerdeCambodiaCameroonCanadaCaribbeanCentral AmericaChileChinaColombiaCongoCosta RicaCroatiaCubaCzechoslovakiaDenmarkDominicaDominican RepublicEastern AfricaEastern AsiaEastern EuropeEcuadorEgyptEl SalvadorEnglandEritreaEthiopiaEuropeFijiFranceGermanyGhanaGreeceGrenadaGuatemalaGuyanaHaitiHondurasHong KongHungaryIndiaIndonesiaIranIraqIrelandIsraelItalyJamaicaJapanJordanKazakhstanKenyaKoreaKuwaitLaosLatin AmericaLatviaLebanonLiberiaLithuaniaMalaysiaMexicoMicronesiaMiddle AfricaMoldovaMoroccoNepalNetherlandsNicaraguaNigeriaNorth AmericaNorth MacedoniaNorthern AfricaNorthern EuropeNorwayOceaniaPakistanPanamaPeruPhilippinesPolandPortugalRomaniaRussiaSaudi ArabiaScotlandSenegalSerbiaSierra LeoneSingaporeSomaliaSouth AfricaSouth AmericaSouth Central AsiaSouth Eastern AsiaSouthern EuropeSpainSri LankaSt. Vincent and the GrenadinesSudanSwedenSwitzerlandSyriaTaiwanThailandTrinidad and TobagoTurkeyUgandaUkraineUruguayUzbekistanVenezuelaVietnamWest IndiesWestern AfricaWestern AsiaYemenZaireZimbabweAzores
Immigrants from Western Europe
Race
Ancestry
AfghanAfricanAlaska NativeAlaskan AthabascanAlbanianAleutAlsatianAmericanApacheArabArapahoArgentineanArmenianAssyrian/Chaldean/SyriacAustralianAustrianBahamianBangladeshiBarbadianBasqueBelgianBelizeanBermudanBhutaneseBlackfeetBolivianBrazilianBritishBritish West IndianBulgarianBurmeseCajunCambodianCanadianCape VerdeanCarpatho RusynCelticCentral AmericanCentral American IndianCherokeeCheyenneChickasawChileanChineseChippewaChoctawColombianColvilleComancheCosta RicanCreeCreekCroatianCrowCubanCypriotCzechCzechoslovakianDanishDelawareDominicanDutchDutch West IndianEastern EuropeanEcuadorianEgyptianEnglishEstonianEthiopianEuropeanFijianFilipinoFinnishFrenchFrench American IndianFrench CanadianGermanGerman RussianGhanaianGreekGuamanian/ChamorroGuatemalanGuyaneseHaitianHmongHonduranHopiHoumaHungarianIcelanderIndian (Asian)IndonesianInupiatIranianIraqiIrishIroquoisIsraeliItalianJamaicanJapaneseJordanianKenyanKiowaKoreanLaotianLatvianLebaneseLiberianLithuanianLumbeeLuxembourgerMacedonianMalaysianMalteseMarshalleseMenomineeMexicanMexican American IndianMongolianMoroccanNative HawaiianNavajoNepaleseNew ZealanderNicaraguanNigerianNorthern EuropeanNorwegianOkinawanOsageOttawaPaiutePakistaniPalestinianPanamanianParaguayanPennsylvania GermanPeruvianPimaPolishPortuguesePotawatomiPuebloPuerto RicanPuget Sound SalishRomanianRussianSalvadoranSamoanScandinavianScotch-IrishScottishSeminoleSenegaleseSerbianShoshoneSierra LeoneanSiouxSlavicSlovakSloveneSomaliSouth AfricanSouth AmericanSouth American IndianSoviet UnionSpaniardSpanishSpanish AmericanSpanish American IndianSri LankanSubsaharan AfricanSudaneseSwedishSwissSyrianTaiwaneseThaiTlingit-HaidaTohono O'OdhamTonganTrinidadian and TobagonianTsimshianTurkishU.S. Virgin IslanderUgandanUkrainianUruguayanUteVenezuelanVietnameseWelshWest IndianYakamaYaquiYugoslavianYumanYup'ikZimbabwean
Immigration
NonimmigrantsImmigrantsAfghanistanAfricaAlbaniaArgentinaArmeniaAsiaAustraliaAustriaBahamasBangladeshBarbadosBelarusBelgiumBelizeBoliviaBosnia and HerzegovinaBrazilBulgariaBurma/MyanmarCabo VerdeCambodiaCameroonCanadaCaribbeanCentral AmericaChileChinaColombiaCongoCosta RicaCroatiaCubaCzechoslovakiaDenmarkDominicaDominican RepublicEastern AfricaEastern AsiaEastern EuropeEcuadorEgyptEl SalvadorEnglandEritreaEthiopiaEuropeFijiFranceGermanyGhanaGreeceGrenadaGuatemalaGuyanaHaitiHondurasHong KongHungaryIndiaIndonesiaIranIraqIrelandIsraelItalyJamaicaJapanJordanKazakhstanKenyaKoreaKuwaitLaosLatin AmericaLatviaLebanonLiberiaLithuaniaMalaysiaMexicoMicronesiaMiddle AfricaMoldovaMoroccoNepalNetherlandsNicaraguaNigeriaNorth AmericaNorth MacedoniaNorthern AfricaNorthern EuropeNorwayOceaniaPakistanPanamaPeruPhilippinesPolandPortugalRomaniaRussiaSaudi ArabiaSenegalSerbiaSierra LeoneSingaporeSomaliaSouth AfricaSouth AmericaSouth Central AsiaSouth Eastern AsiaSouthern EuropeSpainSri LankaSt. Vincent and the GrenadinesSudanSwedenSwitzerlandSyriaTaiwanThailandTrinidad and TobagoTurkeyUgandaUkraineUruguayUzbekistanVenezuelaVietnamWest IndiesWestern AfricaWestern AsiaWestern EuropeYemenZaireZimbabweAzores
Single Father Households
Income
Poverty
Unemployment
Labor Participation
Family Structure
Vehicle Availability
Education Level
Disability

Single Father Households Comparison

Immigrants from Scotland

Immigrants from Western Europe

Exceptional
Exceptional
2.1%
SINGLE FATHER HOUSEHOLDS
99.8/ 100
METRIC RATING
76th/ 347
METRIC RANK
2.1%
SINGLE FATHER HOUSEHOLDS
98.9/ 100
METRIC RATING
101st/ 347
METRIC RANK

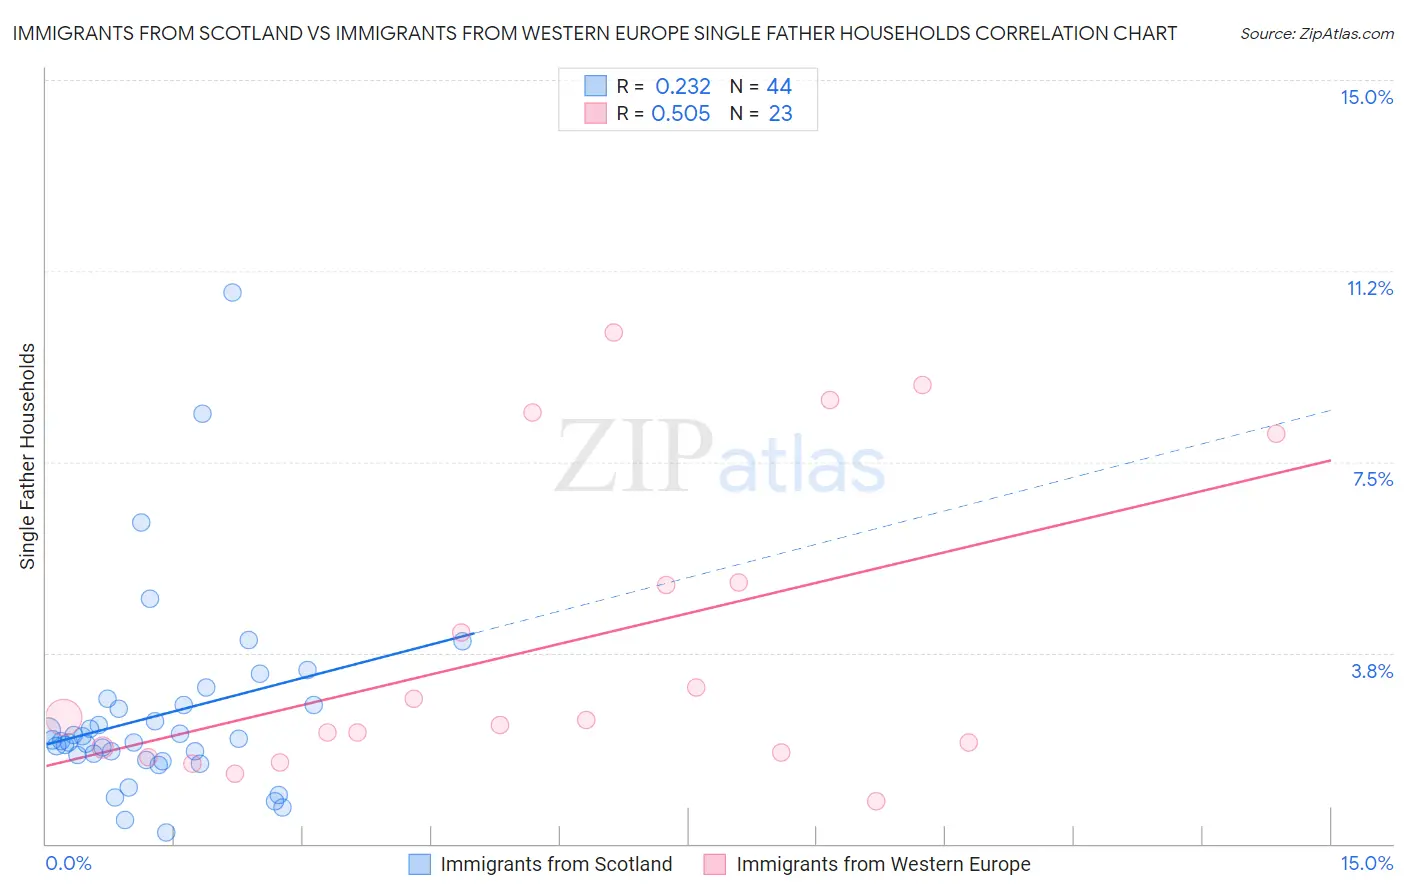
Immigrants from Scotland vs Immigrants from Western Europe Single Father Households Correlation Chart

The statistical analysis conducted on geographies consisting of 195,198,580 people shows a weak positive correlation between the proportion of Immigrants from Scotland and percentage of single father households in the United States with a correlation coefficient (R) of 0.232 and weighted average of 2.1%. Similarly, the statistical analysis conducted on geographies consisting of 486,889,765 people shows a substantial positive correlation between the proportion of Immigrants from Western Europe and percentage of single father households in the United States with a correlation coefficient (R) of 0.505 and weighted average of 2.1%, a difference of 3.3%.
Immigrants from Scotland vs Immigrants from Western Europe Single Father Households

Single Father Households Correlation Summary

MeasurementImmigrants from ScotlandImmigrants from Western Europe
Minimum0.23%0.84%
Maximum10.8%10.0%
Range10.6%9.2%
Mean2.5%3.9%
Median2.0%2.4%
Interquartile 25% (IQ1)1.7%1.8%
Interquartile 75% (IQ3)2.7%5.1%
Interquartile Range (IQR)1.0%3.3%
Standard Deviation (Sample)1.9%2.9%
Standard Deviation (Population)1.9%2.8%

Similar Demographics by Single Father Households

Demographics Similar to Immigrants from Scotland by Single Father Households

In terms of single father households, the demographic groups most similar to Immigrants from Scotland are Immigrants from Sweden (2.1%, a difference of 0.010%), Immigrants from Saudi Arabia (2.1%, a difference of 0.030%), Immigrants from Bangladesh (2.1%, a difference of 0.30%), Immigrants from Egypt (2.1%, a difference of 0.30%), and Estonian (2.1%, a difference of 0.34%).
DemographicsRating | RankSingle Father Households
Immigrants | Romania
99.8
/100
|
#69
Exceptional
2.1%
Egyptians
99.8
/100
|
#70
Exceptional
2.1%
Immigrants | Kuwait
99.8
/100
|
#71
Exceptional
2.1%
Immigrants | Spain
99.8
/100
|
#72
Exceptional
2.1%
Immigrants | Bangladesh
99.8
/100
|
#73
Exceptional
2.1%
Immigrants | Egypt
99.8
/100
|
#74
Exceptional
2.1%
Immigrants | Sweden
99.8
/100
|
#75
Exceptional
2.1%
Immigrants | Scotland
99.8
/100
|
#76
Exceptional
2.1%
Immigrants | Saudi Arabia
99.8
/100
|
#77
Exceptional
2.1%
Estonians
99.7
/100
|
#78
Exceptional
2.1%
Immigrants | Asia
99.7
/100
|
#79
Exceptional
2.1%
Immigrants | South Africa
99.7
/100
|
#80
Exceptional
2.1%
Armenians
99.7
/100
|
#81
Exceptional
2.1%
New Zealanders
99.7
/100
|
#82
Exceptional
2.1%
Greeks
99.7
/100
|
#83
Exceptional
2.1%

Demographics Similar to Immigrants from Western Europe by Single Father Households

In terms of single father households, the demographic groups most similar to Immigrants from Western Europe are Argentinean (2.1%, a difference of 0.030%), Lebanese (2.1%, a difference of 0.050%), Alsatian (2.1%, a difference of 0.070%), Immigrants from Northern Africa (2.1%, a difference of 0.15%), and South African (2.1%, a difference of 0.30%).
DemographicsRating | RankSingle Father Households
Ukrainians
99.3
/100
|
#94
Exceptional
2.1%
Bermudans
99.2
/100
|
#95
Exceptional
2.1%
Arabs
99.2
/100
|
#96
Exceptional
2.1%
Immigrants | Moldova
99.1
/100
|
#97
Exceptional
2.1%
Guyanese
99.1
/100
|
#98
Exceptional
2.1%
South Africans
99.1
/100
|
#99
Exceptional
2.1%
Immigrants | Northern Africa
99.0
/100
|
#100
Exceptional
2.1%
Immigrants | Western Europe
98.9
/100
|
#101
Exceptional
2.1%
Argentineans
98.9
/100
|
#102
Exceptional
2.1%
Lebanese
98.9
/100
|
#103
Exceptional
2.1%
Alsatians
98.9
/100
|
#104
Exceptional
2.1%
Palestinians
98.6
/100
|
#105
Exceptional
2.2%
Immigrants | Southern Europe
98.6
/100
|
#106
Exceptional
2.2%
Slovenes
98.5
/100
|
#107
Exceptional
2.2%
Immigrants | Netherlands
98.5
/100
|
#108
Exceptional
2.2%