Czech vs Immigrants from Western Europe Single Father Households
COMPARE
Czech
Immigrants from Western Europe
Single Father Households
Single Father Households Comparison
Czechs
Immigrants from Western Europe
2.3%
SINGLE FATHER HOUSEHOLDS
62.5/ 100
METRIC RATING
169th/ 347
METRIC RANK
2.1%
SINGLE FATHER HOUSEHOLDS
98.9/ 100
METRIC RATING
101st/ 347
METRIC RANK
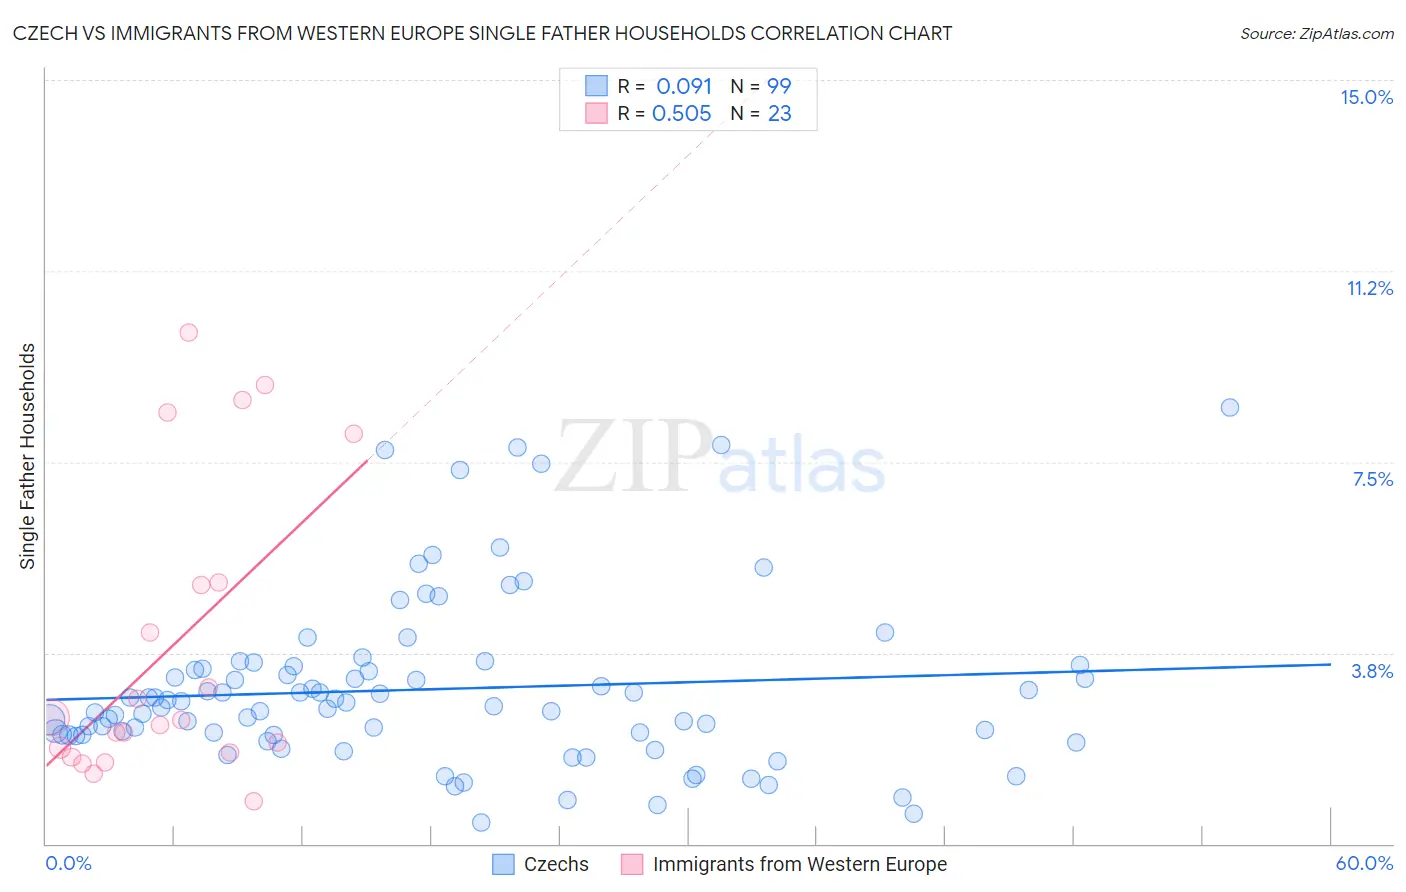
Czech vs Immigrants from Western Europe Single Father Households Correlation Chart
The statistical analysis conducted on geographies consisting of 477,253,750 people shows a slight positive correlation between the proportion of Czechs and percentage of single father households in the United States with a correlation coefficient (R) of 0.091 and weighted average of 2.3%. Similarly, the statistical analysis conducted on geographies consisting of 486,889,765 people shows a substantial positive correlation between the proportion of Immigrants from Western Europe and percentage of single father households in the United States with a correlation coefficient (R) of 0.505 and weighted average of 2.1%, a difference of 8.0%.
Single Father Households Correlation Summary
| Measurement | Czech | Immigrants from Western Europe |
| Minimum | 0.41% | 0.84% |
| Maximum | 8.6% | 10.0% |
| Range | 8.2% | 9.2% |
| Mean | 3.0% | 3.9% |
| Median | 2.7% | 2.4% |
| Interquartile 25% (IQ1) | 2.1% | 1.8% |
| Interquartile 75% (IQ3) | 3.4% | 5.1% |
| Interquartile Range (IQR) | 1.3% | 3.3% |
| Standard Deviation (Sample) | 1.7% | 2.9% |
| Standard Deviation (Population) | 1.6% | 2.8% |
Similar Demographics by Single Father Households
Demographics Similar to Czechs by Single Father Households
In terms of single father households, the demographic groups most similar to Czechs are Ugandan (2.3%, a difference of 0.020%), Icelander (2.3%, a difference of 0.040%), Swedish (2.3%, a difference of 0.070%), South American (2.3%, a difference of 0.14%), and Czechoslovakian (2.3%, a difference of 0.29%).
| Demographics | Rating | Rank | Single Father Households |
| Scottish | 72.8 /100 | #162 | Good 2.3% |
| Irish | 72.1 /100 | #163 | Good 2.3% |
| Pakistanis | 70.6 /100 | #164 | Good 2.3% |
| Scotch-Irish | 69.4 /100 | #165 | Good 2.3% |
| English | 68.6 /100 | #166 | Good 2.3% |
| South Americans | 64.3 /100 | #167 | Good 2.3% |
| Icelanders | 63.1 /100 | #168 | Good 2.3% |
| Czechs | 62.5 /100 | #169 | Good 2.3% |
| Ugandans | 62.2 /100 | #170 | Good 2.3% |
| Swedes | 61.6 /100 | #171 | Good 2.3% |
| Czechoslovakians | 58.9 /100 | #172 | Average 2.3% |
| Celtics | 55.4 /100 | #173 | Average 2.3% |
| Afghans | 50.0 /100 | #174 | Average 2.3% |
| Immigrants | Jamaica | 49.1 /100 | #175 | Average 2.3% |
| Danes | 48.2 /100 | #176 | Average 2.3% |
Demographics Similar to Immigrants from Western Europe by Single Father Households
In terms of single father households, the demographic groups most similar to Immigrants from Western Europe are Argentinean (2.1%, a difference of 0.030%), Lebanese (2.1%, a difference of 0.050%), Alsatian (2.1%, a difference of 0.070%), Immigrants from Northern Africa (2.1%, a difference of 0.15%), and South African (2.1%, a difference of 0.30%).
| Demographics | Rating | Rank | Single Father Households |
| Ukrainians | 99.3 /100 | #94 | Exceptional 2.1% |
| Bermudans | 99.2 /100 | #95 | Exceptional 2.1% |
| Arabs | 99.2 /100 | #96 | Exceptional 2.1% |
| Immigrants | Moldova | 99.1 /100 | #97 | Exceptional 2.1% |
| Guyanese | 99.1 /100 | #98 | Exceptional 2.1% |
| South Africans | 99.1 /100 | #99 | Exceptional 2.1% |
| Immigrants | Northern Africa | 99.0 /100 | #100 | Exceptional 2.1% |
| Immigrants | Western Europe | 98.9 /100 | #101 | Exceptional 2.1% |
| Argentineans | 98.9 /100 | #102 | Exceptional 2.1% |
| Lebanese | 98.9 /100 | #103 | Exceptional 2.1% |
| Alsatians | 98.9 /100 | #104 | Exceptional 2.1% |
| Palestinians | 98.6 /100 | #105 | Exceptional 2.2% |
| Immigrants | Southern Europe | 98.6 /100 | #106 | Exceptional 2.2% |
| Slovenes | 98.5 /100 | #107 | Exceptional 2.2% |
| Immigrants | Netherlands | 98.5 /100 | #108 | Exceptional 2.2% |