Latvian vs Immigrants from Serbia Single Male Poverty
COMPARE
Latvian
Immigrants from Serbia
Single Male Poverty
Single Male Poverty Comparison
Latvians
Immigrants from Serbia
12.7%
SINGLE MALE POVERTY
67.9/ 100
METRIC RATING
157th/ 347
METRIC RANK
11.4%
SINGLE MALE POVERTY
100.0/ 100
METRIC RATING
36th/ 347
METRIC RANK
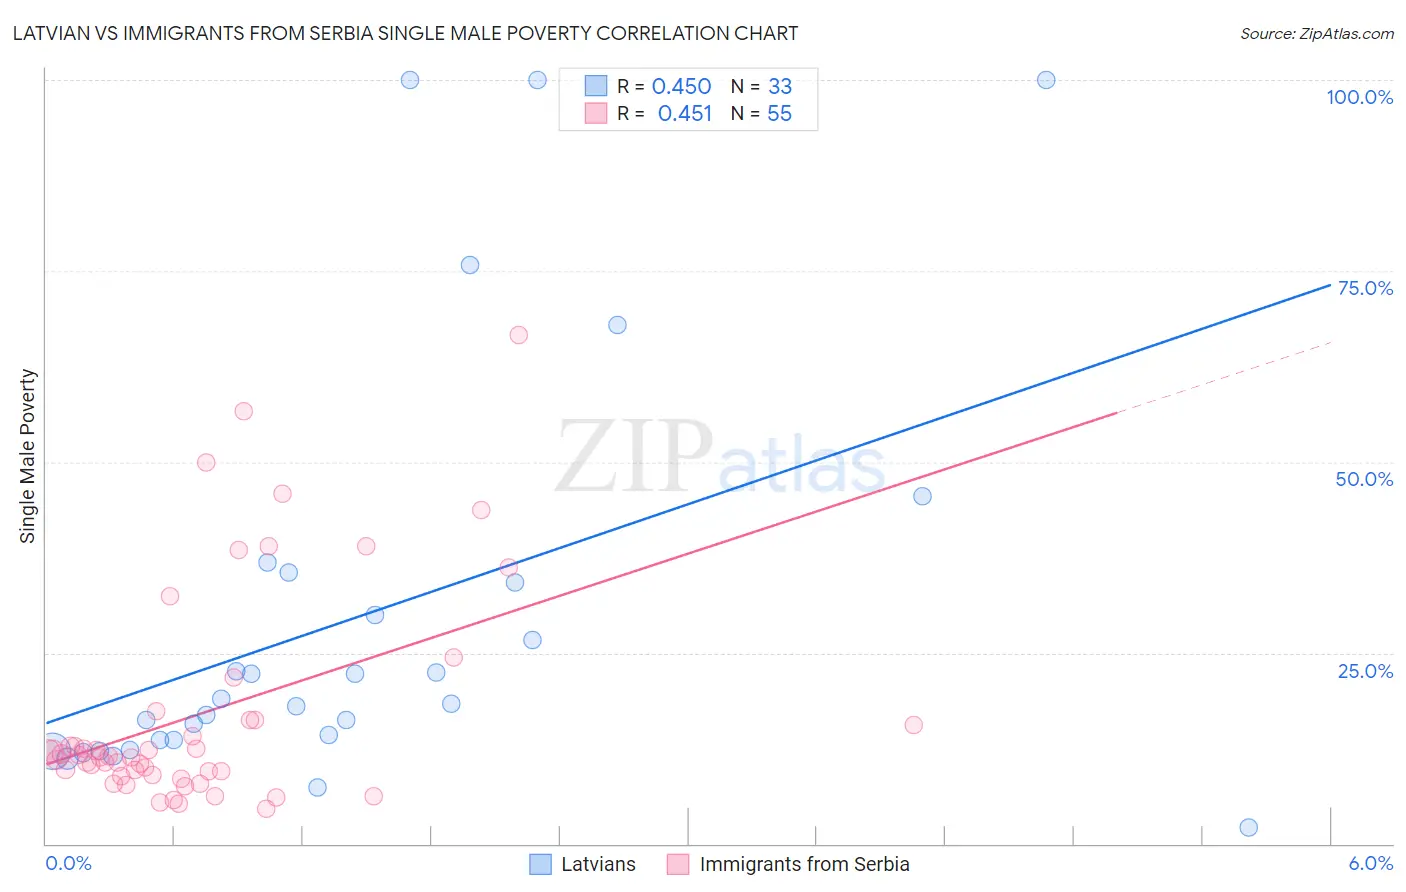
Latvian vs Immigrants from Serbia Single Male Poverty Correlation Chart
The statistical analysis conducted on geographies consisting of 199,264,855 people shows a moderate positive correlation between the proportion of Latvians and poverty level among single males in the United States with a correlation coefficient (R) of 0.450 and weighted average of 12.7%. Similarly, the statistical analysis conducted on geographies consisting of 122,836,577 people shows a moderate positive correlation between the proportion of Immigrants from Serbia and poverty level among single males in the United States with a correlation coefficient (R) of 0.451 and weighted average of 11.4%, a difference of 10.7%.
Single Male Poverty Correlation Summary
| Measurement | Latvian | Immigrants from Serbia |
| Minimum | 2.2% | 4.6% |
| Maximum | 100.0% | 66.7% |
| Range | 97.8% | 62.0% |
| Mean | 29.8% | 17.1% |
| Median | 18.3% | 11.5% |
| Interquartile 25% (IQ1) | 13.0% | 8.9% |
| Interquartile 75% (IQ3) | 34.9% | 16.2% |
| Interquartile Range (IQR) | 21.9% | 7.3% |
| Standard Deviation (Sample) | 27.4% | 14.3% |
| Standard Deviation (Population) | 27.0% | 14.2% |
Similar Demographics by Single Male Poverty
Demographics Similar to Latvians by Single Male Poverty
In terms of single male poverty, the demographic groups most similar to Latvians are Vietnamese (12.7%, a difference of 0.0%), Immigrants from Spain (12.7%, a difference of 0.040%), Immigrants from Scotland (12.7%, a difference of 0.060%), Immigrants (12.7%, a difference of 0.13%), and Immigrants from Middle Africa (12.7%, a difference of 0.18%).
| Demographics | Rating | Rank | Single Male Poverty |
| Immigrants | Panama | 72.1 /100 | #150 | Good 12.6% |
| Immigrants | Hungary | 71.9 /100 | #151 | Good 12.6% |
| Australians | 71.4 /100 | #152 | Good 12.6% |
| Immigrants | Immigrants | 70.1 /100 | #153 | Good 12.7% |
| Immigrants | Scotland | 68.9 /100 | #154 | Good 12.7% |
| Immigrants | Spain | 68.7 /100 | #155 | Good 12.7% |
| Vietnamese | 67.9 /100 | #156 | Good 12.7% |
| Latvians | 67.9 /100 | #157 | Good 12.7% |
| Immigrants | Middle Africa | 64.9 /100 | #158 | Good 12.7% |
| Immigrants | Liberia | 64.2 /100 | #159 | Good 12.7% |
| Greeks | 64.1 /100 | #160 | Good 12.7% |
| Immigrants | Africa | 63.4 /100 | #161 | Good 12.7% |
| Eastern Europeans | 63.3 /100 | #162 | Good 12.7% |
| Palestinians | 63.1 /100 | #163 | Good 12.7% |
| Immigrants | Nigeria | 62.8 /100 | #164 | Good 12.7% |
Demographics Similar to Immigrants from Serbia by Single Male Poverty
In terms of single male poverty, the demographic groups most similar to Immigrants from Serbia are Immigrants from South Eastern Asia (11.4%, a difference of 0.030%), Immigrants from Singapore (11.4%, a difference of 0.050%), Immigrants from Ethiopia (11.4%, a difference of 0.070%), Immigrants from Vietnam (11.4%, a difference of 0.11%), and Sri Lankan (11.5%, a difference of 0.11%).
| Demographics | Rating | Rank | Single Male Poverty |
| Immigrants | Egypt | 100.0 /100 | #29 | Exceptional 11.4% |
| Iranians | 100.0 /100 | #30 | Exceptional 11.4% |
| Immigrants | Iran | 100.0 /100 | #31 | Exceptional 11.4% |
| Immigrants | Eastern Asia | 100.0 /100 | #32 | Exceptional 11.4% |
| Immigrants | Vietnam | 100.0 /100 | #33 | Exceptional 11.4% |
| Immigrants | Ethiopia | 100.0 /100 | #34 | Exceptional 11.4% |
| Immigrants | South Eastern Asia | 100.0 /100 | #35 | Exceptional 11.4% |
| Immigrants | Serbia | 100.0 /100 | #36 | Exceptional 11.4% |
| Immigrants | Singapore | 100.0 /100 | #37 | Exceptional 11.4% |
| Sri Lankans | 100.0 /100 | #38 | Exceptional 11.5% |
| Soviet Union | 100.0 /100 | #39 | Exceptional 11.5% |
| Immigrants | Korea | 100.0 /100 | #40 | Exceptional 11.5% |
| Immigrants | Iraq | 99.9 /100 | #41 | Exceptional 11.5% |
| Egyptians | 99.9 /100 | #42 | Exceptional 11.5% |
| Immigrants | Peru | 99.9 /100 | #43 | Exceptional 11.5% |