South African vs Immigrants from Iran Family Households
COMPARE
South African
Immigrants from Iran
Family Households
Family Households Comparison
South Africans
Immigrants from Iran
63.4%
FAMILY HOUSEHOLDS
1.9/ 100
METRIC RATING
240th/ 347
METRIC RANK
64.1%
FAMILY HOUSEHOLDS
30.4/ 100
METRIC RATING
185th/ 347
METRIC RANK
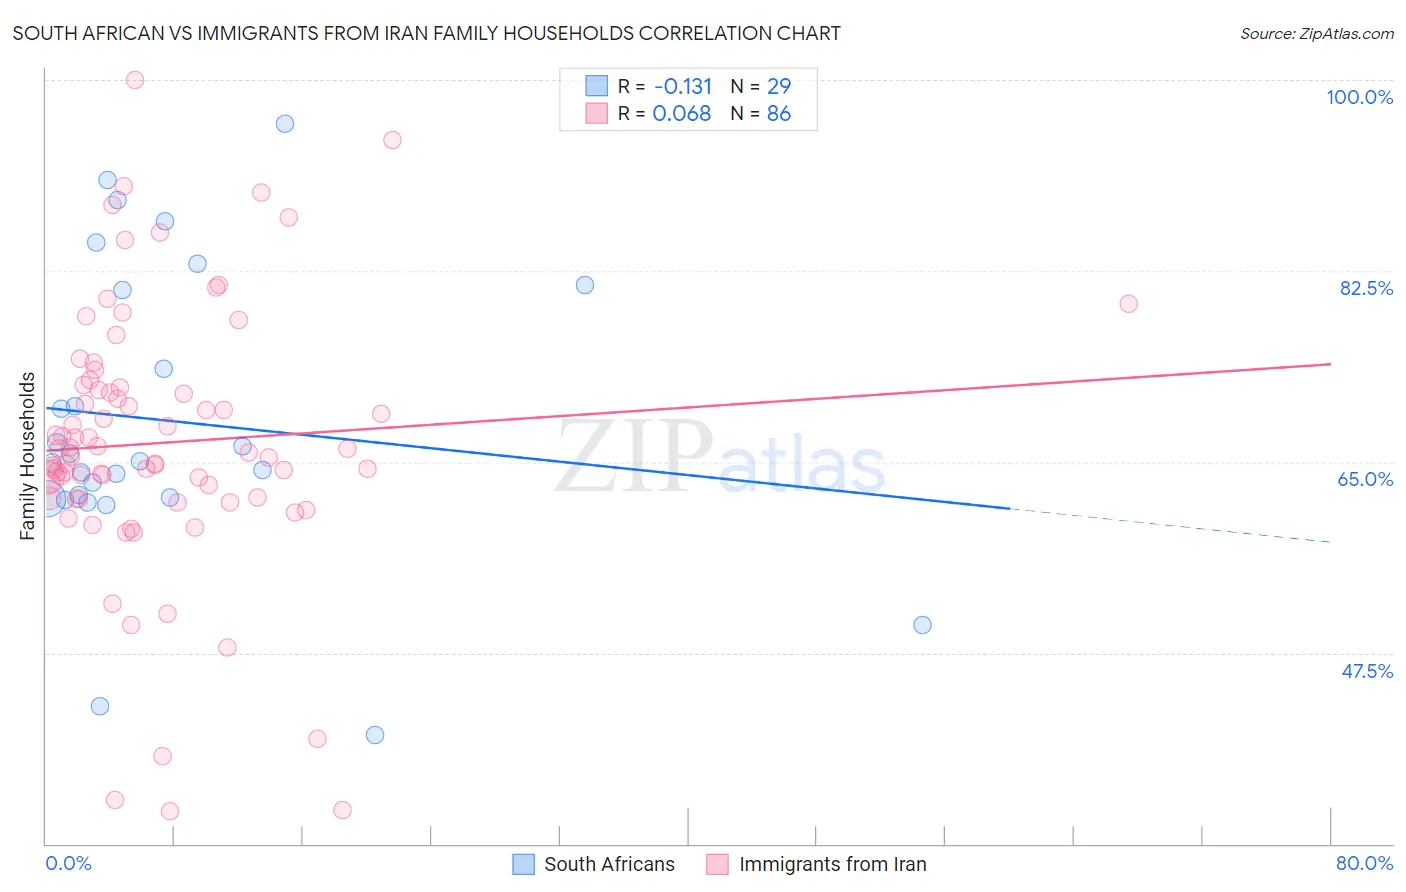
South African vs Immigrants from Iran Family Households Correlation Chart
The statistical analysis conducted on geographies consisting of 182,542,946 people shows a poor negative correlation between the proportion of South Africans and percentage of family households in the United States with a correlation coefficient (R) of -0.131 and weighted average of 63.4%. Similarly, the statistical analysis conducted on geographies consisting of 279,831,456 people shows a slight positive correlation between the proportion of Immigrants from Iran and percentage of family households in the United States with a correlation coefficient (R) of 0.068 and weighted average of 64.1%, a difference of 1.1%.
Family Households Correlation Summary
| Measurement | South African | Immigrants from Iran |
| Minimum | 40.0% | 33.0% |
| Maximum | 96.0% | 100.0% |
| Range | 56.0% | 67.0% |
| Mean | 68.7% | 66.7% |
| Median | 65.1% | 65.7% |
| Interquartile 25% (IQ1) | 61.7% | 61.7% |
| Interquartile 75% (IQ3) | 81.0% | 71.8% |
| Interquartile Range (IQR) | 19.3% | 10.2% |
| Standard Deviation (Sample) | 13.5% | 12.3% |
| Standard Deviation (Population) | 13.2% | 12.3% |
Similar Demographics by Family Households
Demographics Similar to South Africans by Family Households
In terms of family households, the demographic groups most similar to South Africans are Aleut (63.4%, a difference of 0.0%), Immigrants from St. Vincent and the Grenadines (63.4%, a difference of 0.010%), Immigrants from Israel (63.4%, a difference of 0.010%), Comanche (63.5%, a difference of 0.030%), and Immigrants from Zimbabwe (63.5%, a difference of 0.030%).
| Demographics | Rating | Rank | Family Households |
| Immigrants | Armenia | 2.6 /100 | #233 | Tragic 63.5% |
| Finns | 2.3 /100 | #234 | Tragic 63.5% |
| Albanians | 2.2 /100 | #235 | Tragic 63.5% |
| Ghanaians | 2.1 /100 | #236 | Tragic 63.5% |
| Comanche | 2.1 /100 | #237 | Tragic 63.5% |
| Immigrants | Zimbabwe | 2.0 /100 | #238 | Tragic 63.5% |
| Aleuts | 1.9 /100 | #239 | Tragic 63.4% |
| South Africans | 1.9 /100 | #240 | Tragic 63.4% |
| Immigrants | St. Vincent and the Grenadines | 1.9 /100 | #241 | Tragic 63.4% |
| Immigrants | Israel | 1.8 /100 | #242 | Tragic 63.4% |
| Immigrants | Czechoslovakia | 1.8 /100 | #243 | Tragic 63.4% |
| Eastern Europeans | 1.6 /100 | #244 | Tragic 63.4% |
| Immigrants | Dominica | 1.6 /100 | #245 | Tragic 63.4% |
| Immigrants | Ghana | 1.6 /100 | #246 | Tragic 63.4% |
| Immigrants | Uzbekistan | 1.5 /100 | #247 | Tragic 63.4% |
Demographics Similar to Immigrants from Iran by Family Households
In terms of family households, the demographic groups most similar to Immigrants from Iran are Spanish American (64.1%, a difference of 0.010%), Northern European (64.1%, a difference of 0.040%), Puerto Rican (64.2%, a difference of 0.050%), Ukrainian (64.2%, a difference of 0.060%), and Creek (64.2%, a difference of 0.060%).
| Demographics | Rating | Rank | Family Households |
| Jamaicans | 40.6 /100 | #178 | Average 64.2% |
| Immigrants | Ukraine | 38.2 /100 | #179 | Fair 64.2% |
| Immigrants | Honduras | 35.0 /100 | #180 | Fair 64.2% |
| Immigrants | Trinidad and Tobago | 34.9 /100 | #181 | Fair 64.2% |
| Ukrainians | 34.6 /100 | #182 | Fair 64.2% |
| Creek | 34.1 /100 | #183 | Fair 64.2% |
| Puerto Ricans | 33.4 /100 | #184 | Fair 64.2% |
| Immigrants | Iran | 30.4 /100 | #185 | Fair 64.1% |
| Spanish Americans | 30.1 /100 | #186 | Fair 64.1% |
| Northern Europeans | 28.2 /100 | #187 | Fair 64.1% |
| Paraguayans | 26.7 /100 | #188 | Fair 64.1% |
| Immigrants | Western Asia | 25.3 /100 | #189 | Fair 64.1% |
| Zimbabweans | 24.7 /100 | #190 | Fair 64.1% |
| Arabs | 24.5 /100 | #191 | Fair 64.1% |
| Lithuanians | 23.8 /100 | #192 | Fair 64.0% |