Immigrants from Scotland vs Immigrants from Iran Family Households
COMPARE
Immigrants from Scotland
Immigrants from Iran
Family Households
Family Households Comparison
Immigrants from Scotland
Immigrants from Iran
64.7%
FAMILY HOUSEHOLDS
86.4/ 100
METRIC RATING
137th/ 347
METRIC RANK
64.1%
FAMILY HOUSEHOLDS
30.4/ 100
METRIC RATING
185th/ 347
METRIC RANK
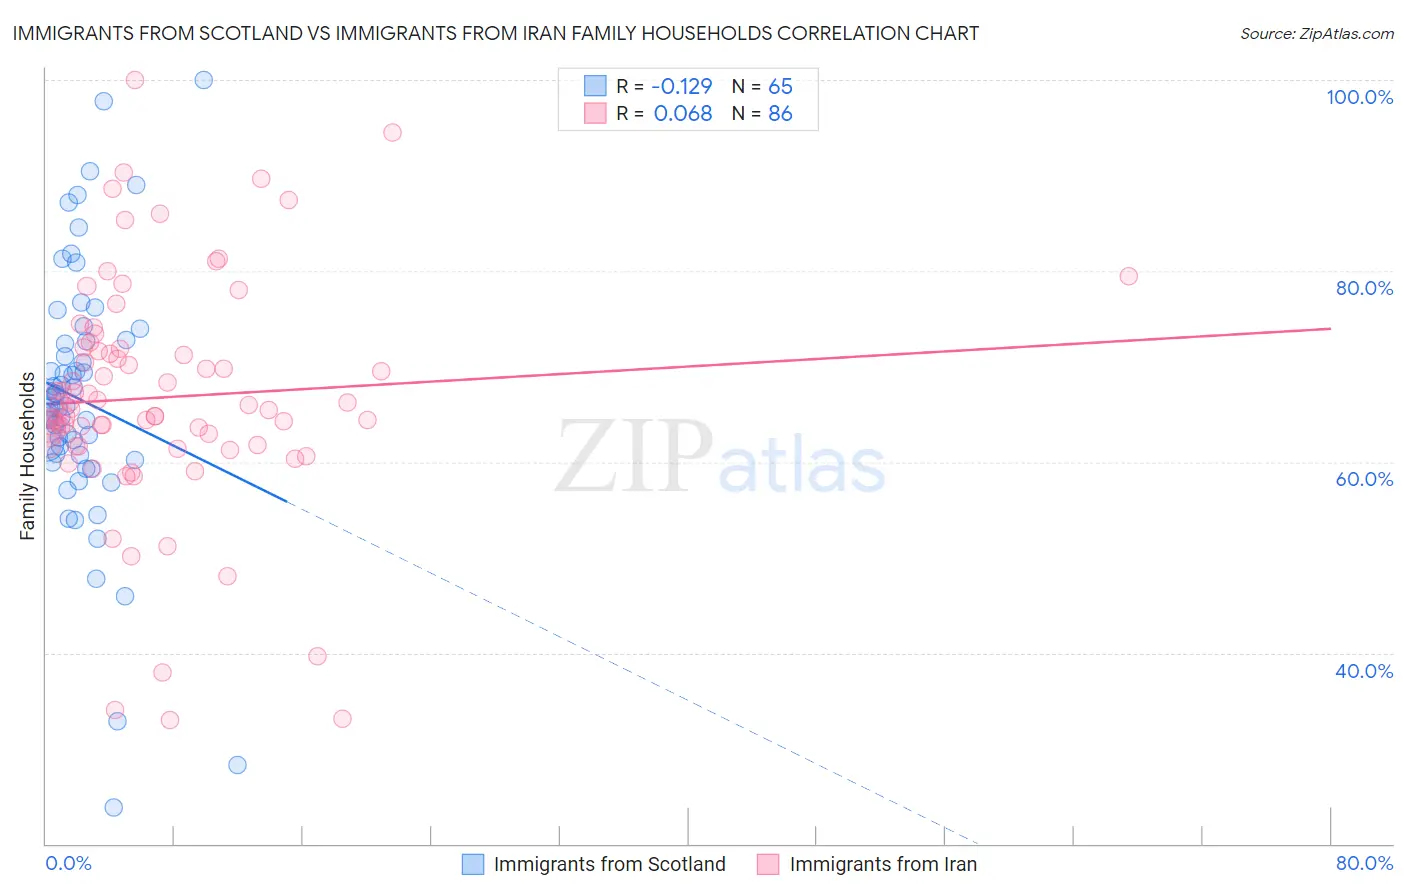
Immigrants from Scotland vs Immigrants from Iran Family Households Correlation Chart
The statistical analysis conducted on geographies consisting of 196,383,501 people shows a poor negative correlation between the proportion of Immigrants from Scotland and percentage of family households in the United States with a correlation coefficient (R) of -0.129 and weighted average of 64.7%. Similarly, the statistical analysis conducted on geographies consisting of 279,831,456 people shows a slight positive correlation between the proportion of Immigrants from Iran and percentage of family households in the United States with a correlation coefficient (R) of 0.068 and weighted average of 64.1%, a difference of 0.90%.
Family Households Correlation Summary
| Measurement | Immigrants from Scotland | Immigrants from Iran |
| Minimum | 23.8% | 33.0% |
| Maximum | 100.0% | 100.0% |
| Range | 76.2% | 67.0% |
| Mean | 66.5% | 66.7% |
| Median | 65.8% | 65.7% |
| Interquartile 25% (IQ1) | 60.5% | 61.7% |
| Interquartile 75% (IQ3) | 72.7% | 71.8% |
| Interquartile Range (IQR) | 12.2% | 10.2% |
| Standard Deviation (Sample) | 13.8% | 12.3% |
| Standard Deviation (Population) | 13.7% | 12.3% |
Similar Demographics by Family Households
Demographics Similar to Immigrants from Scotland by Family Households
In terms of family households, the demographic groups most similar to Immigrants from Scotland are Immigrants from China (64.7%, a difference of 0.010%), Basque (64.7%, a difference of 0.020%), Maltese (64.7%, a difference of 0.030%), Immigrants from Jamaica (64.7%, a difference of 0.030%), and Immigrants from North Macedonia (64.7%, a difference of 0.040%).
| Demographics | Rating | Rank | Family Households |
| Immigrants | Italy | 90.2 /100 | #130 | Exceptional 64.8% |
| Immigrants | Nonimmigrants | 90.1 /100 | #131 | Exceptional 64.8% |
| Cajuns | 89.4 /100 | #132 | Excellent 64.8% |
| Belizeans | 89.3 /100 | #133 | Excellent 64.8% |
| Greeks | 88.1 /100 | #134 | Excellent 64.7% |
| Maltese | 87.4 /100 | #135 | Excellent 64.7% |
| Immigrants | China | 86.6 /100 | #136 | Excellent 64.7% |
| Immigrants | Scotland | 86.4 /100 | #137 | Excellent 64.7% |
| Basques | 85.5 /100 | #138 | Excellent 64.7% |
| Immigrants | Jamaica | 85.3 /100 | #139 | Excellent 64.7% |
| Immigrants | North Macedonia | 84.9 /100 | #140 | Excellent 64.7% |
| Immigrants | Cameroon | 84.8 /100 | #141 | Excellent 64.7% |
| Pakistanis | 84.0 /100 | #142 | Excellent 64.7% |
| Czechoslovakians | 82.1 /100 | #143 | Excellent 64.6% |
| South American Indians | 81.9 /100 | #144 | Excellent 64.6% |
Demographics Similar to Immigrants from Iran by Family Households
In terms of family households, the demographic groups most similar to Immigrants from Iran are Spanish American (64.1%, a difference of 0.010%), Northern European (64.1%, a difference of 0.040%), Puerto Rican (64.2%, a difference of 0.050%), Ukrainian (64.2%, a difference of 0.060%), and Creek (64.2%, a difference of 0.060%).
| Demographics | Rating | Rank | Family Households |
| Jamaicans | 40.6 /100 | #178 | Average 64.2% |
| Immigrants | Ukraine | 38.2 /100 | #179 | Fair 64.2% |
| Immigrants | Honduras | 35.0 /100 | #180 | Fair 64.2% |
| Immigrants | Trinidad and Tobago | 34.9 /100 | #181 | Fair 64.2% |
| Ukrainians | 34.6 /100 | #182 | Fair 64.2% |
| Creek | 34.1 /100 | #183 | Fair 64.2% |
| Puerto Ricans | 33.4 /100 | #184 | Fair 64.2% |
| Immigrants | Iran | 30.4 /100 | #185 | Fair 64.1% |
| Spanish Americans | 30.1 /100 | #186 | Fair 64.1% |
| Northern Europeans | 28.2 /100 | #187 | Fair 64.1% |
| Paraguayans | 26.7 /100 | #188 | Fair 64.1% |
| Immigrants | Western Asia | 25.3 /100 | #189 | Fair 64.1% |
| Zimbabweans | 24.7 /100 | #190 | Fair 64.1% |
| Arabs | 24.5 /100 | #191 | Fair 64.1% |
| Lithuanians | 23.8 /100 | #192 | Fair 64.0% |