Pennsylvania German vs Estonian Currently Married
COMPARE
Pennsylvania German
Estonian
Currently Married
Currently Married Comparison
Pennsylvania Germans
Estonians
49.6%
CURRENTLY MARRIED
99.9/ 100
METRIC RATING
15th/ 347
METRIC RANK
48.2%
CURRENTLY MARRIED
97.4/ 100
METRIC RATING
74th/ 347
METRIC RANK
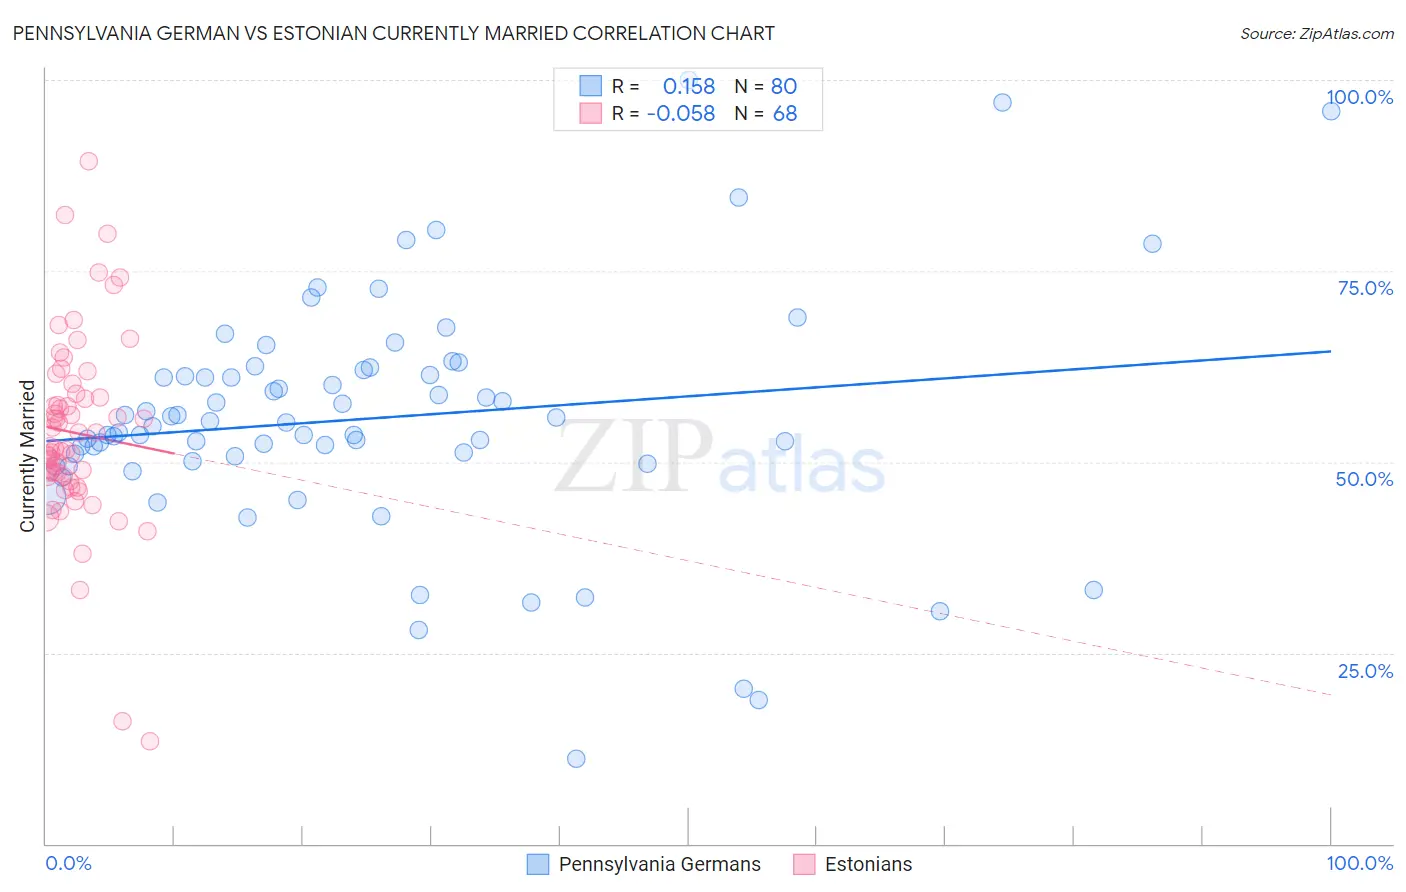
Pennsylvania German vs Estonian Currently Married Correlation Chart
The statistical analysis conducted on geographies consisting of 234,101,517 people shows a poor positive correlation between the proportion of Pennsylvania Germans and percentage of population currently married in the United States with a correlation coefficient (R) of 0.158 and weighted average of 49.6%. Similarly, the statistical analysis conducted on geographies consisting of 123,509,767 people shows a slight negative correlation between the proportion of Estonians and percentage of population currently married in the United States with a correlation coefficient (R) of -0.058 and weighted average of 48.2%, a difference of 2.9%.
Currently Married Correlation Summary
| Measurement | Pennsylvania German | Estonian |
| Minimum | 11.1% | 13.5% |
| Maximum | 100.0% | 89.3% |
| Range | 88.9% | 75.8% |
| Mean | 55.7% | 53.8% |
| Median | 55.0% | 51.9% |
| Interquartile 25% (IQ1) | 50.4% | 48.1% |
| Interquartile 75% (IQ3) | 61.7% | 58.7% |
| Interquartile Range (IQR) | 11.3% | 10.6% |
| Standard Deviation (Sample) | 15.5% | 12.4% |
| Standard Deviation (Population) | 15.4% | 12.3% |
Similar Demographics by Currently Married
Demographics Similar to Pennsylvania Germans by Currently Married
In terms of currently married, the demographic groups most similar to Pennsylvania Germans are German (49.6%, a difference of 0.030%), Dutch (49.6%, a difference of 0.040%), Chinese (49.5%, a difference of 0.14%), Scandinavian (49.5%, a difference of 0.16%), and English (49.7%, a difference of 0.30%).
| Demographics | Rating | Rank | Currently Married |
| Swedes | 100.0 /100 | #8 | Exceptional 50.0% |
| Czechs | 99.9 /100 | #9 | Exceptional 49.9% |
| Filipinos | 99.9 /100 | #10 | Exceptional 49.7% |
| English | 99.9 /100 | #11 | Exceptional 49.7% |
| Swiss | 99.9 /100 | #12 | Exceptional 49.7% |
| Dutch | 99.9 /100 | #13 | Exceptional 49.6% |
| Germans | 99.9 /100 | #14 | Exceptional 49.6% |
| Pennsylvania Germans | 99.9 /100 | #15 | Exceptional 49.6% |
| Chinese | 99.9 /100 | #16 | Exceptional 49.5% |
| Scandinavians | 99.9 /100 | #17 | Exceptional 49.5% |
| Immigrants | Scotland | 99.8 /100 | #18 | Exceptional 49.3% |
| Europeans | 99.8 /100 | #19 | Exceptional 49.3% |
| Luxembourgers | 99.8 /100 | #20 | Exceptional 49.3% |
| Scottish | 99.8 /100 | #21 | Exceptional 49.2% |
| Bulgarians | 99.7 /100 | #22 | Exceptional 49.1% |
Demographics Similar to Estonians by Currently Married
In terms of currently married, the demographic groups most similar to Estonians are Immigrants from Eastern Asia (48.2%, a difference of 0.030%), Immigrants from Lebanon (48.2%, a difference of 0.050%), Immigrants from Belarus (48.1%, a difference of 0.070%), Basque (48.1%, a difference of 0.090%), and Slovene (48.1%, a difference of 0.11%).
| Demographics | Rating | Rank | Currently Married |
| Slovaks | 98.2 /100 | #67 | Exceptional 48.3% |
| Immigrants | England | 98.2 /100 | #68 | Exceptional 48.3% |
| Canadians | 98.1 /100 | #69 | Exceptional 48.3% |
| Immigrants | Asia | 97.9 /100 | #70 | Exceptional 48.3% |
| Macedonians | 97.9 /100 | #71 | Exceptional 48.3% |
| Immigrants | Lebanon | 97.6 /100 | #72 | Exceptional 48.2% |
| Immigrants | Eastern Asia | 97.5 /100 | #73 | Exceptional 48.2% |
| Estonians | 97.4 /100 | #74 | Exceptional 48.2% |
| Immigrants | Belarus | 97.2 /100 | #75 | Exceptional 48.1% |
| Basques | 97.2 /100 | #76 | Exceptional 48.1% |
| Slovenes | 97.1 /100 | #77 | Exceptional 48.1% |
| Immigrants | Belgium | 97.1 /100 | #78 | Exceptional 48.1% |
| Immigrants | South Africa | 97.0 /100 | #79 | Exceptional 48.1% |
| Immigrants | Poland | 96.9 /100 | #80 | Exceptional 48.1% |
| Immigrants | Sri Lanka | 96.9 /100 | #81 | Exceptional 48.1% |