Laotian vs Immigrants from Uzbekistan Married-couple Households
COMPARE
Laotian
Immigrants from Uzbekistan
Married-couple Households
Married-couple Households Comparison
Laotians
Immigrants from Uzbekistan
48.4%
MARRIED-COUPLE HOUSEHOLDS
98.8/ 100
METRIC RATING
71st/ 347
METRIC RANK
45.4%
MARRIED-COUPLE HOUSEHOLDS
8.4/ 100
METRIC RATING
209th/ 347
METRIC RANK
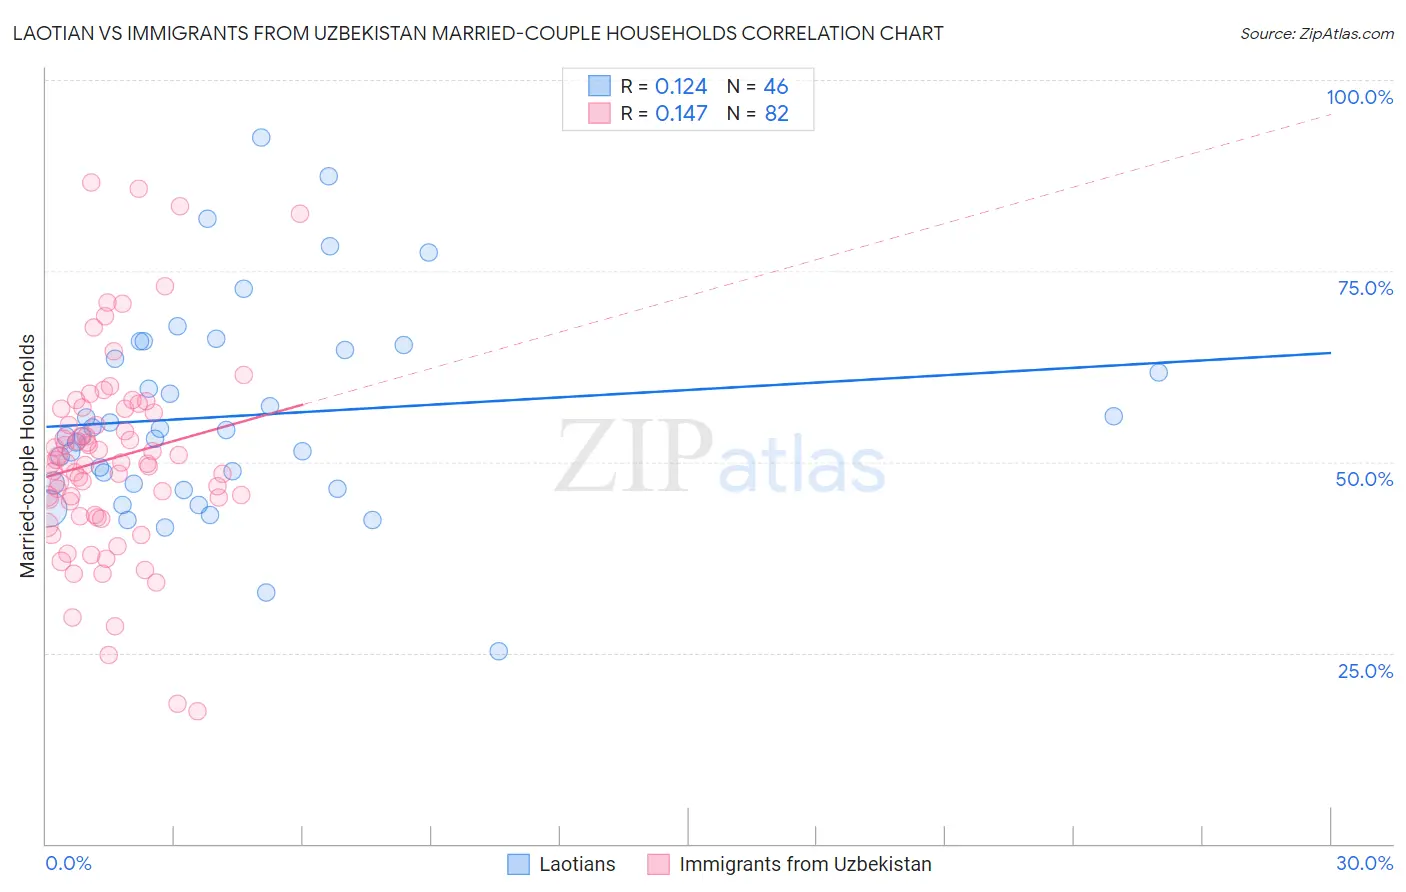
Laotian vs Immigrants from Uzbekistan Married-couple Households Correlation Chart
The statistical analysis conducted on geographies consisting of 224,741,438 people shows a poor positive correlation between the proportion of Laotians and percentage of married-couple family households in the United States with a correlation coefficient (R) of 0.124 and weighted average of 48.4%. Similarly, the statistical analysis conducted on geographies consisting of 118,716,463 people shows a poor positive correlation between the proportion of Immigrants from Uzbekistan and percentage of married-couple family households in the United States with a correlation coefficient (R) of 0.147 and weighted average of 45.4%, a difference of 6.6%.
Married-couple Households Correlation Summary
| Measurement | Laotian | Immigrants from Uzbekistan |
| Minimum | 25.2% | 17.4% |
| Maximum | 92.4% | 86.6% |
| Range | 67.2% | 69.2% |
| Mean | 56.0% | 50.4% |
| Median | 53.8% | 49.8% |
| Interquartile 25% (IQ1) | 47.2% | 43.1% |
| Interquartile 75% (IQ3) | 64.7% | 56.9% |
| Interquartile Range (IQR) | 17.5% | 13.9% |
| Standard Deviation (Sample) | 13.5% | 13.1% |
| Standard Deviation (Population) | 13.3% | 13.0% |
Similar Demographics by Married-couple Households
Demographics Similar to Laotians by Married-couple Households
In terms of married-couple households, the demographic groups most similar to Laotians are Immigrants from North America (48.4%, a difference of 0.010%), Immigrants from South Eastern Asia (48.4%, a difference of 0.050%), Immigrants from China (48.4%, a difference of 0.050%), Jordanian (48.4%, a difference of 0.070%), and Romanian (48.4%, a difference of 0.070%).
| Demographics | Rating | Rank | Married-couple Households |
| Northern Europeans | 99.0 /100 | #64 | Exceptional 48.4% |
| Immigrants | Canada | 99.0 /100 | #65 | Exceptional 48.4% |
| Jordanians | 98.9 /100 | #66 | Exceptional 48.4% |
| Romanians | 98.9 /100 | #67 | Exceptional 48.4% |
| Immigrants | South Eastern Asia | 98.9 /100 | #68 | Exceptional 48.4% |
| Immigrants | China | 98.9 /100 | #69 | Exceptional 48.4% |
| Immigrants | North America | 98.9 /100 | #70 | Exceptional 48.4% |
| Laotians | 98.8 /100 | #71 | Exceptional 48.4% |
| Scotch-Irish | 98.6 /100 | #72 | Exceptional 48.3% |
| Immigrants | Singapore | 98.6 /100 | #73 | Exceptional 48.3% |
| Immigrants | Romania | 98.6 /100 | #74 | Exceptional 48.3% |
| Immigrants | England | 98.4 /100 | #75 | Exceptional 48.2% |
| Immigrants | Fiji | 98.4 /100 | #76 | Exceptional 48.2% |
| Canadians | 98.2 /100 | #77 | Exceptional 48.2% |
| Egyptians | 98.2 /100 | #78 | Exceptional 48.2% |
Demographics Similar to Immigrants from Uzbekistan by Married-couple Households
In terms of married-couple households, the demographic groups most similar to Immigrants from Uzbekistan are Hispanic or Latino (45.4%, a difference of 0.040%), Immigrants from France (45.4%, a difference of 0.050%), Cuban (45.4%, a difference of 0.090%), Immigrants from Spain (45.3%, a difference of 0.14%), and Uruguayan (45.5%, a difference of 0.23%).
| Demographics | Rating | Rank | Married-couple Households |
| Immigrants | Central America | 14.2 /100 | #202 | Poor 45.7% |
| Alaska Natives | 13.0 /100 | #203 | Poor 45.6% |
| Aleuts | 12.5 /100 | #204 | Poor 45.6% |
| Nepalese | 11.9 /100 | #205 | Poor 45.6% |
| Uruguayans | 10.4 /100 | #206 | Poor 45.5% |
| Immigrants | France | 8.8 /100 | #207 | Tragic 45.4% |
| Hispanics or Latinos | 8.7 /100 | #208 | Tragic 45.4% |
| Immigrants | Uzbekistan | 8.4 /100 | #209 | Tragic 45.4% |
| Cubans | 7.7 /100 | #210 | Tragic 45.4% |
| Immigrants | Spain | 7.3 /100 | #211 | Tragic 45.3% |
| Creek | 6.4 /100 | #212 | Tragic 45.3% |
| Yakama | 5.8 /100 | #213 | Tragic 45.2% |
| Japanese | 5.7 /100 | #214 | Tragic 45.2% |
| Immigrants | Nepal | 5.6 /100 | #215 | Tragic 45.2% |
| Immigrants | Portugal | 5.6 /100 | #216 | Tragic 45.2% |