Korean vs Immigrants from Russia Family Households
COMPARE
Korean
Immigrants from Russia
Family Households
Family Households Comparison
Koreans
Immigrants from Russia
68.3%
FAMILY HOUSEHOLDS
100.0/ 100
METRIC RATING
12th/ 347
METRIC RANK
63.2%
FAMILY HOUSEHOLDS
0.6/ 100
METRIC RATING
261st/ 347
METRIC RANK
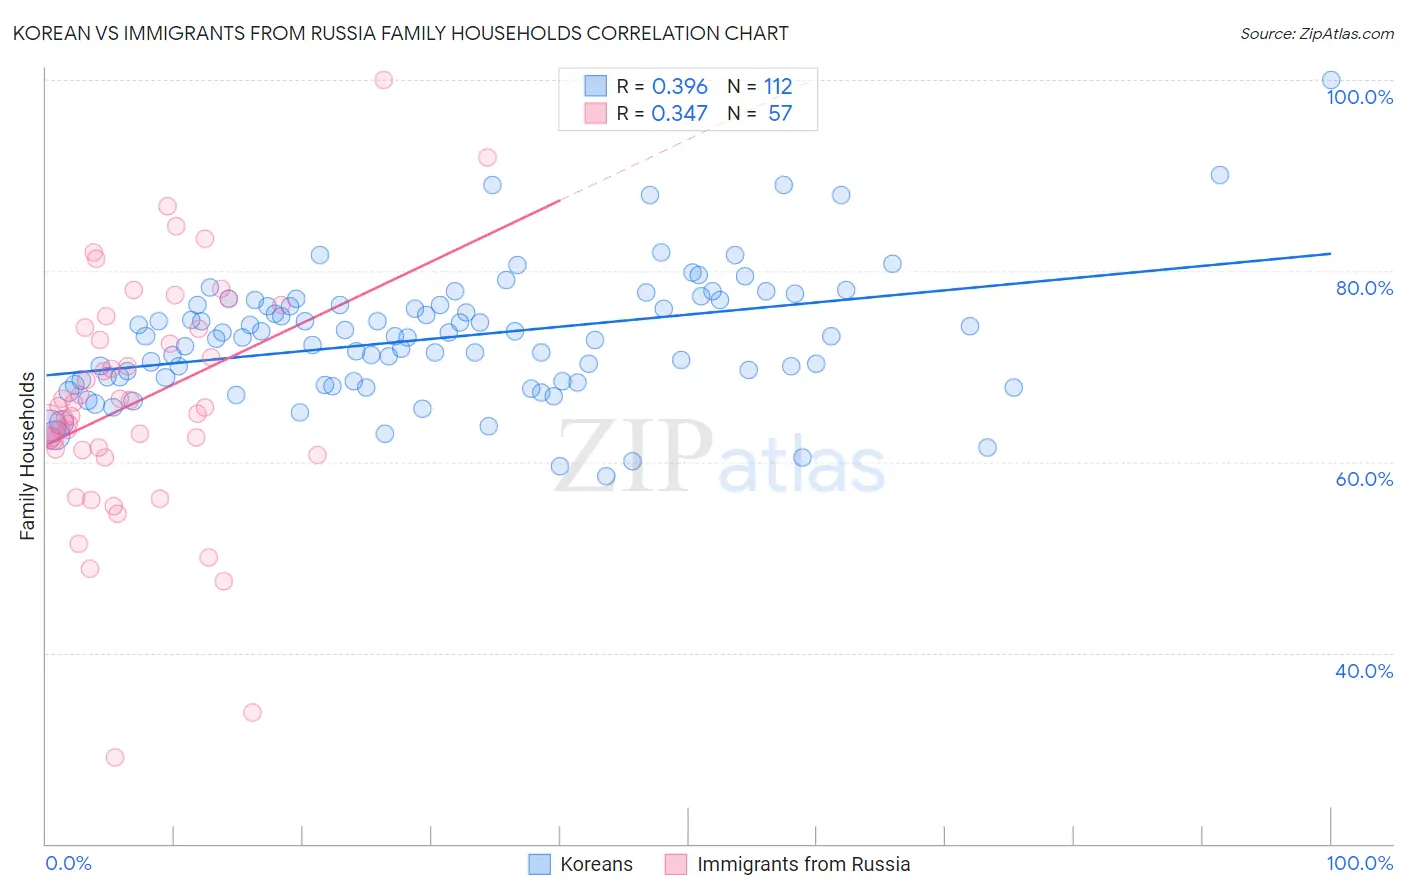
Korean vs Immigrants from Russia Family Households Correlation Chart
The statistical analysis conducted on geographies consisting of 510,403,530 people shows a mild positive correlation between the proportion of Koreans and percentage of family households in the United States with a correlation coefficient (R) of 0.396 and weighted average of 68.3%. Similarly, the statistical analysis conducted on geographies consisting of 347,722,193 people shows a mild positive correlation between the proportion of Immigrants from Russia and percentage of family households in the United States with a correlation coefficient (R) of 0.347 and weighted average of 63.2%, a difference of 8.0%.
Family Households Correlation Summary
| Measurement | Korean | Immigrants from Russia |
| Minimum | 58.5% | 29.0% |
| Maximum | 100.0% | 100.0% |
| Range | 41.5% | 71.0% |
| Mean | 73.0% | 66.4% |
| Median | 73.1% | 65.8% |
| Interquartile 25% (IQ1) | 68.4% | 61.3% |
| Interquartile 75% (IQ3) | 76.5% | 74.0% |
| Interquartile Range (IQR) | 8.1% | 12.7% |
| Standard Deviation (Sample) | 6.7% | 12.4% |
| Standard Deviation (Population) | 6.7% | 12.3% |
Similar Demographics by Family Households
Demographics Similar to Koreans by Family Households
In terms of family households, the demographic groups most similar to Koreans are Immigrants from Central America (68.3%, a difference of 0.030%), Pueblo (68.2%, a difference of 0.080%), Immigrants from Cuba (68.2%, a difference of 0.090%), Immigrants from Philippines (68.3%, a difference of 0.10%), and Assyrian/Chaldean/Syriac (68.2%, a difference of 0.15%).
| Demographics | Rating | Rank | Family Households |
| Yuman | 100.0 /100 | #5 | Exceptional 69.3% |
| Immigrants | Mexico | 100.0 /100 | #6 | Exceptional 69.1% |
| Mexicans | 100.0 /100 | #7 | Exceptional 69.0% |
| Immigrants | Fiji | 100.0 /100 | #8 | Exceptional 68.8% |
| Native Hawaiians | 100.0 /100 | #9 | Exceptional 68.4% |
| Immigrants | Philippines | 100.0 /100 | #10 | Exceptional 68.3% |
| Immigrants | Central America | 100.0 /100 | #11 | Exceptional 68.3% |
| Koreans | 100.0 /100 | #12 | Exceptional 68.3% |
| Pueblo | 100.0 /100 | #13 | Exceptional 68.2% |
| Immigrants | Cuba | 100.0 /100 | #14 | Exceptional 68.2% |
| Assyrians/Chaldeans/Syriacs | 100.0 /100 | #15 | Exceptional 68.2% |
| Immigrants | Vietnam | 100.0 /100 | #16 | Exceptional 68.2% |
| Chinese | 100.0 /100 | #17 | Exceptional 68.1% |
| Immigrants | Taiwan | 100.0 /100 | #18 | Exceptional 68.0% |
| Samoans | 100.0 /100 | #19 | Exceptional 67.9% |
Demographics Similar to Immigrants from Russia by Family Households
In terms of family households, the demographic groups most similar to Immigrants from Russia are Immigrants from Ireland (63.2%, a difference of 0.010%), Cypriot (63.2%, a difference of 0.020%), Cheyenne (63.2%, a difference of 0.030%), Immigrants from Western Europe (63.2%, a difference of 0.040%), and Kenyan (63.2%, a difference of 0.040%).
| Demographics | Rating | Rank | Family Households |
| Slovaks | 1.0 /100 | #254 | Tragic 63.3% |
| Potawatomi | 1.0 /100 | #255 | Tragic 63.3% |
| Luxembourgers | 0.9 /100 | #256 | Tragic 63.3% |
| Icelanders | 0.8 /100 | #257 | Tragic 63.3% |
| Immigrants | Barbados | 0.7 /100 | #258 | Tragic 63.2% |
| Immigrants | Western Europe | 0.6 /100 | #259 | Tragic 63.2% |
| Cypriots | 0.6 /100 | #260 | Tragic 63.2% |
| Immigrants | Russia | 0.6 /100 | #261 | Tragic 63.2% |
| Immigrants | Ireland | 0.6 /100 | #262 | Tragic 63.2% |
| Cheyenne | 0.5 /100 | #263 | Tragic 63.2% |
| Kenyans | 0.5 /100 | #264 | Tragic 63.2% |
| Colville | 0.5 /100 | #265 | Tragic 63.2% |
| Immigrants | Western Africa | 0.5 /100 | #266 | Tragic 63.1% |
| Israelis | 0.4 /100 | #267 | Tragic 63.1% |
| Immigrants | Singapore | 0.4 /100 | #268 | Tragic 63.1% |