Korean vs Immigrants from Laos No Schooling Completed
COMPARE
Korean
Immigrants from Laos
No Schooling Completed
No Schooling Completed Comparison
Koreans
Immigrants from Laos
2.4%
NO SCHOOLING COMPLETED
1.7/ 100
METRIC RATING
241st/ 347
METRIC RANK
3.1%
NO SCHOOLING COMPLETED
0.0/ 100
METRIC RATING
321st/ 347
METRIC RANK
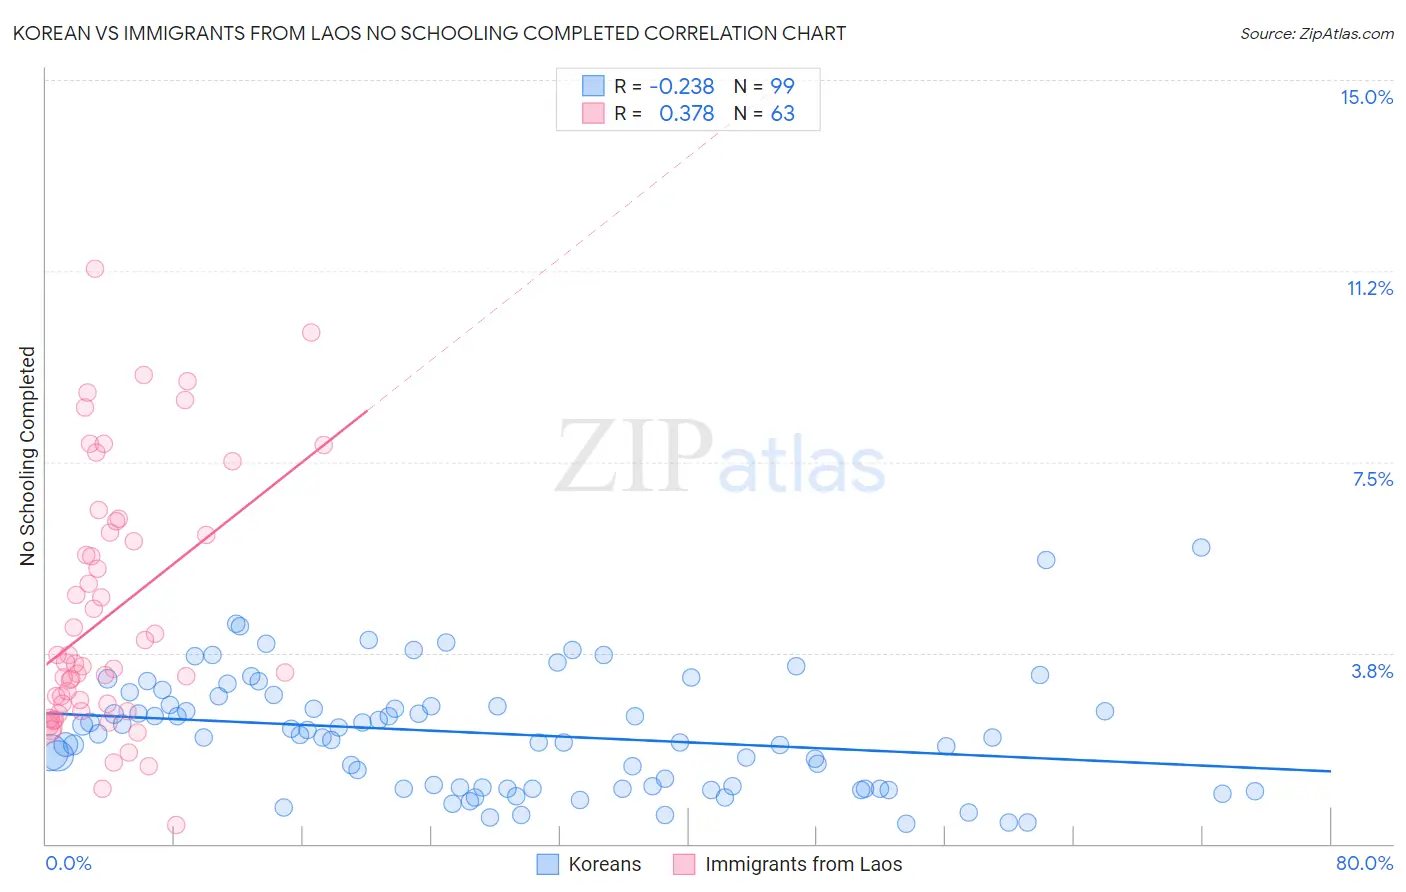
Korean vs Immigrants from Laos No Schooling Completed Correlation Chart
The statistical analysis conducted on geographies consisting of 502,061,970 people shows a weak negative correlation between the proportion of Koreans and percentage of population with no schooling in the United States with a correlation coefficient (R) of -0.238 and weighted average of 2.4%. Similarly, the statistical analysis conducted on geographies consisting of 200,828,935 people shows a mild positive correlation between the proportion of Immigrants from Laos and percentage of population with no schooling in the United States with a correlation coefficient (R) of 0.378 and weighted average of 3.1%, a difference of 32.4%.
No Schooling Completed Correlation Summary
| Measurement | Korean | Immigrants from Laos |
| Minimum | 0.40% | 0.36% |
| Maximum | 5.8% | 11.3% |
| Range | 5.4% | 10.9% |
| Mean | 2.2% | 4.5% |
| Median | 2.1% | 3.5% |
| Interquartile 25% (IQ1) | 1.1% | 2.6% |
| Interquartile 75% (IQ3) | 2.9% | 6.1% |
| Interquartile Range (IQR) | 1.8% | 3.5% |
| Standard Deviation (Sample) | 1.1% | 2.5% |
| Standard Deviation (Population) | 1.1% | 2.5% |
Similar Demographics by No Schooling Completed
Demographics Similar to Koreans by No Schooling Completed
In terms of no schooling completed, the demographic groups most similar to Koreans are Immigrants from Senegal (2.4%, a difference of 0.060%), Liberian (2.4%, a difference of 0.29%), Immigrants from Indonesia (2.4%, a difference of 0.32%), South American (2.4%, a difference of 0.36%), and Paiute (2.4%, a difference of 0.41%).
| Demographics | Rating | Rank | No Schooling Completed |
| Nigerians | 2.6 /100 | #234 | Tragic 2.3% |
| Immigrants | Western Asia | 2.6 /100 | #235 | Tragic 2.3% |
| Iraqis | 2.2 /100 | #236 | Tragic 2.4% |
| Immigrants | Eastern Asia | 2.0 /100 | #237 | Tragic 2.4% |
| Paiute | 1.9 /100 | #238 | Tragic 2.4% |
| Liberians | 1.8 /100 | #239 | Tragic 2.4% |
| Immigrants | Senegal | 1.7 /100 | #240 | Tragic 2.4% |
| Koreans | 1.7 /100 | #241 | Tragic 2.4% |
| Immigrants | Indonesia | 1.5 /100 | #242 | Tragic 2.4% |
| South Americans | 1.5 /100 | #243 | Tragic 2.4% |
| Peruvians | 1.4 /100 | #244 | Tragic 2.4% |
| Bolivians | 1.4 /100 | #245 | Tragic 2.4% |
| Immigrants | Congo | 1.4 /100 | #246 | Tragic 2.4% |
| Immigrants | Iraq | 1.3 /100 | #247 | Tragic 2.4% |
| Asians | 1.2 /100 | #248 | Tragic 2.4% |
Demographics Similar to Immigrants from Laos by No Schooling Completed
In terms of no schooling completed, the demographic groups most similar to Immigrants from Laos are Immigrants from Bangladesh (3.1%, a difference of 0.11%), Immigrants from Burma/Myanmar (3.1%, a difference of 0.15%), Immigrants from Honduras (3.2%, a difference of 0.67%), Vietnamese (3.2%, a difference of 0.86%), and Immigrants from Guyana (3.1%, a difference of 0.89%).
| Demographics | Rating | Rank | No Schooling Completed |
| Immigrants | Belize | 0.0 /100 | #314 | Tragic 3.1% |
| Immigrants | Nicaragua | 0.0 /100 | #315 | Tragic 3.1% |
| Immigrants | Ecuador | 0.0 /100 | #316 | Tragic 3.1% |
| Cape Verdeans | 0.0 /100 | #317 | Tragic 3.1% |
| Immigrants | Guyana | 0.0 /100 | #318 | Tragic 3.1% |
| Immigrants | Burma/Myanmar | 0.0 /100 | #319 | Tragic 3.1% |
| Immigrants | Bangladesh | 0.0 /100 | #320 | Tragic 3.1% |
| Immigrants | Laos | 0.0 /100 | #321 | Tragic 3.1% |
| Immigrants | Honduras | 0.0 /100 | #322 | Tragic 3.2% |
| Vietnamese | 0.0 /100 | #323 | Tragic 3.2% |
| Mexican American Indians | 0.0 /100 | #324 | Tragic 3.2% |
| Dominicans | 0.0 /100 | #325 | Tragic 3.2% |
| Indonesians | 0.0 /100 | #326 | Tragic 3.2% |
| Immigrants | Latin America | 0.0 /100 | #327 | Tragic 3.3% |
| Mexicans | 0.0 /100 | #328 | Tragic 3.3% |