Korean vs British West Indian Family Households
COMPARE
Korean
British West Indian
Family Households
Family Households Comparison
Koreans
British West Indians
68.3%
FAMILY HOUSEHOLDS
100.0/ 100
METRIC RATING
12th/ 347
METRIC RANK
62.8%
FAMILY HOUSEHOLDS
0.1/ 100
METRIC RATING
286th/ 347
METRIC RANK
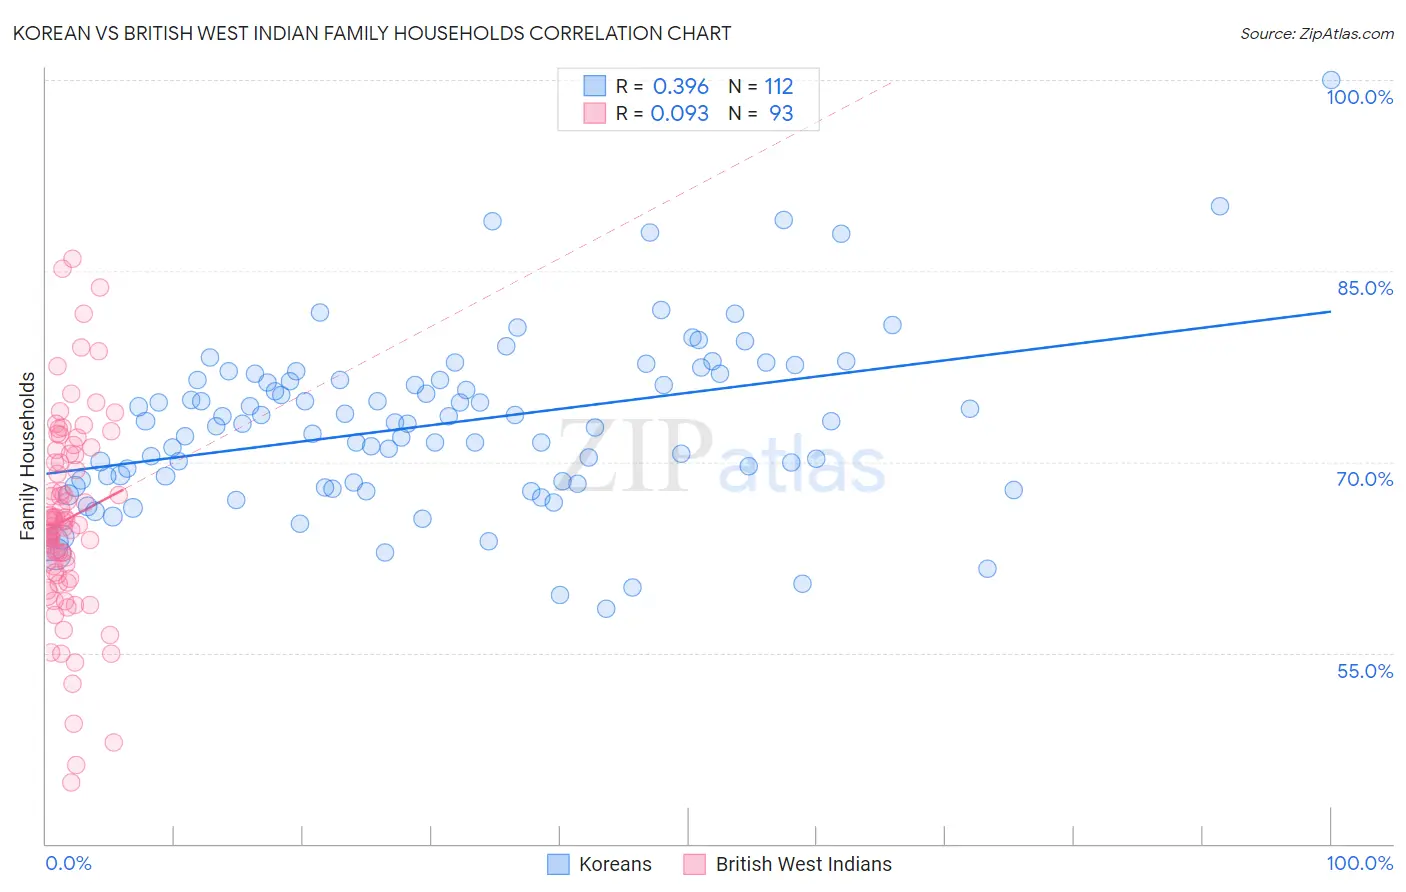
Korean vs British West Indian Family Households Correlation Chart
The statistical analysis conducted on geographies consisting of 510,403,530 people shows a mild positive correlation between the proportion of Koreans and percentage of family households in the United States with a correlation coefficient (R) of 0.396 and weighted average of 68.3%. Similarly, the statistical analysis conducted on geographies consisting of 152,638,699 people shows a slight positive correlation between the proportion of British West Indians and percentage of family households in the United States with a correlation coefficient (R) of 0.093 and weighted average of 62.8%, a difference of 8.8%.
Family Households Correlation Summary
| Measurement | Korean | British West Indian |
| Minimum | 58.5% | 44.8% |
| Maximum | 100.0% | 86.0% |
| Range | 41.5% | 41.2% |
| Mean | 73.0% | 65.5% |
| Median | 73.1% | 65.0% |
| Interquartile 25% (IQ1) | 68.4% | 61.2% |
| Interquartile 75% (IQ3) | 76.5% | 70.6% |
| Interquartile Range (IQR) | 8.1% | 9.4% |
| Standard Deviation (Sample) | 6.7% | 7.8% |
| Standard Deviation (Population) | 6.7% | 7.7% |
Similar Demographics by Family Households
Demographics Similar to Koreans by Family Households
In terms of family households, the demographic groups most similar to Koreans are Immigrants from Central America (68.3%, a difference of 0.030%), Pueblo (68.2%, a difference of 0.080%), Immigrants from Cuba (68.2%, a difference of 0.090%), Immigrants from Philippines (68.3%, a difference of 0.10%), and Assyrian/Chaldean/Syriac (68.2%, a difference of 0.15%).
| Demographics | Rating | Rank | Family Households |
| Yuman | 100.0 /100 | #5 | Exceptional 69.3% |
| Immigrants | Mexico | 100.0 /100 | #6 | Exceptional 69.1% |
| Mexicans | 100.0 /100 | #7 | Exceptional 69.0% |
| Immigrants | Fiji | 100.0 /100 | #8 | Exceptional 68.8% |
| Native Hawaiians | 100.0 /100 | #9 | Exceptional 68.4% |
| Immigrants | Philippines | 100.0 /100 | #10 | Exceptional 68.3% |
| Immigrants | Central America | 100.0 /100 | #11 | Exceptional 68.3% |
| Koreans | 100.0 /100 | #12 | Exceptional 68.3% |
| Pueblo | 100.0 /100 | #13 | Exceptional 68.2% |
| Immigrants | Cuba | 100.0 /100 | #14 | Exceptional 68.2% |
| Assyrians/Chaldeans/Syriacs | 100.0 /100 | #15 | Exceptional 68.2% |
| Immigrants | Vietnam | 100.0 /100 | #16 | Exceptional 68.2% |
| Chinese | 100.0 /100 | #17 | Exceptional 68.1% |
| Immigrants | Taiwan | 100.0 /100 | #18 | Exceptional 68.0% |
| Samoans | 100.0 /100 | #19 | Exceptional 67.9% |
Demographics Similar to British West Indians by Family Households
In terms of family households, the demographic groups most similar to British West Indians are Latvian (62.8%, a difference of 0.0%), Immigrants from Uganda (62.7%, a difference of 0.020%), Mongolian (62.8%, a difference of 0.030%), Immigrants from Nepal (62.7%, a difference of 0.11%), and Australian (62.8%, a difference of 0.13%).
| Demographics | Rating | Rank | Family Households |
| Immigrants | Yemen | 0.2 /100 | #279 | Tragic 63.0% |
| Immigrants | Bulgaria | 0.2 /100 | #280 | Tragic 63.0% |
| Estonians | 0.2 /100 | #281 | Tragic 62.9% |
| New Zealanders | 0.1 /100 | #282 | Tragic 62.9% |
| Immigrants | Denmark | 0.1 /100 | #283 | Tragic 62.9% |
| Australians | 0.1 /100 | #284 | Tragic 62.8% |
| Mongolians | 0.1 /100 | #285 | Tragic 62.8% |
| British West Indians | 0.1 /100 | #286 | Tragic 62.8% |
| Latvians | 0.1 /100 | #287 | Tragic 62.8% |
| Immigrants | Uganda | 0.1 /100 | #288 | Tragic 62.7% |
| Immigrants | Nepal | 0.1 /100 | #289 | Tragic 62.7% |
| Immigrants | Grenada | 0.0 /100 | #290 | Tragic 62.6% |
| U.S. Virgin Islanders | 0.0 /100 | #291 | Tragic 62.6% |
| Immigrants | Burma/Myanmar | 0.0 /100 | #292 | Tragic 62.6% |
| Immigrants | Sweden | 0.0 /100 | #293 | Tragic 62.5% |