Korean vs Immigrants from Eastern Africa Disability Age 35 to 64
COMPARE
Korean
Immigrants from Eastern Africa
Disability Age 35 to 64
Disability Age 35 to 64 Comparison
Koreans
Immigrants from Eastern Africa
10.5%
DISABILITY AGE 35 TO 64
97.1/ 100
METRIC RATING
110th/ 347
METRIC RANK
11.3%
DISABILITY AGE 35 TO 64
42.2/ 100
METRIC RATING
177th/ 347
METRIC RANK
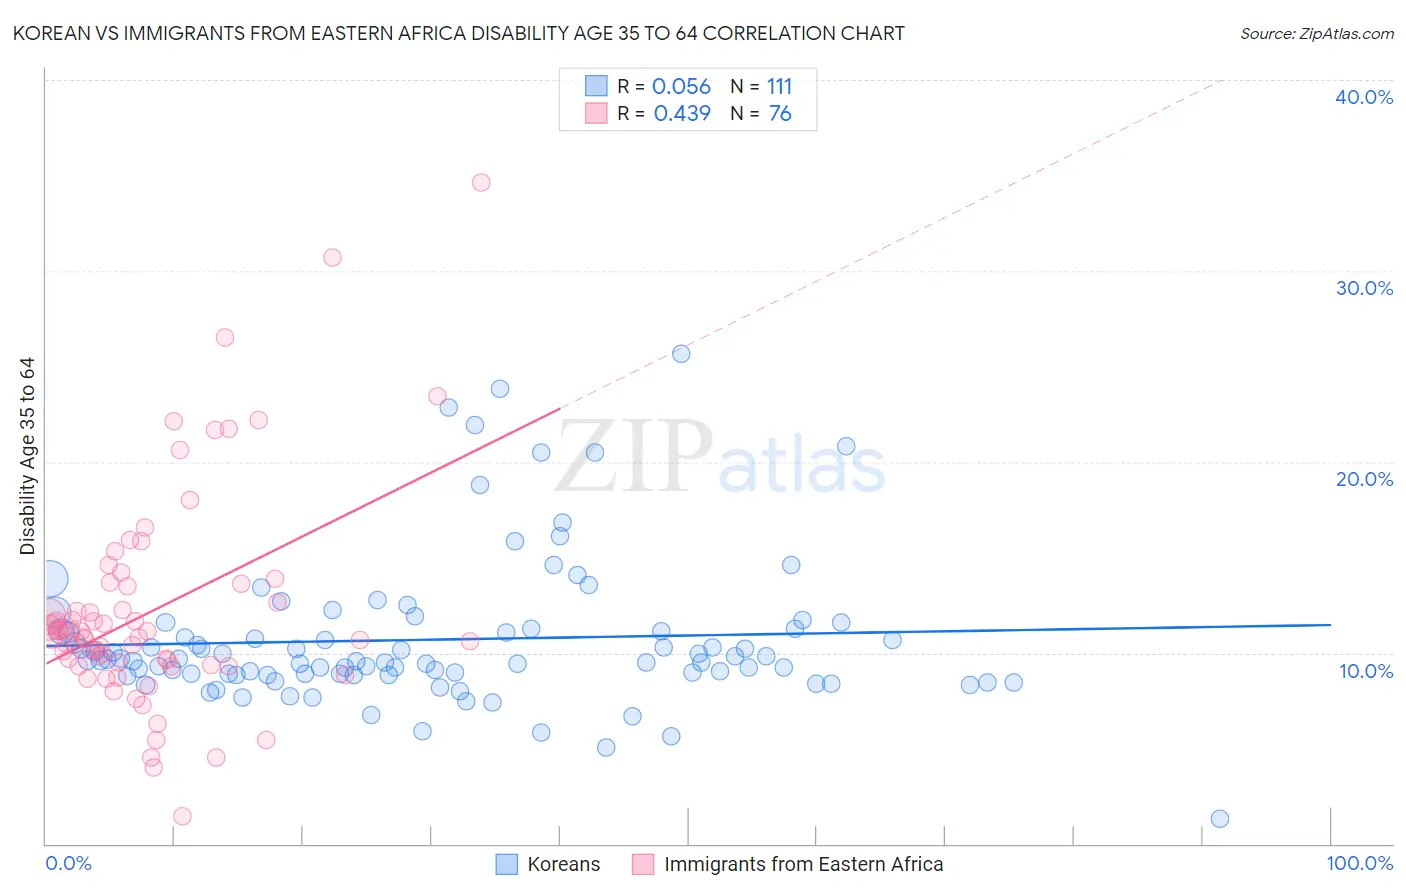
Korean vs Immigrants from Eastern Africa Disability Age 35 to 64 Correlation Chart
The statistical analysis conducted on geographies consisting of 510,268,552 people shows a slight positive correlation between the proportion of Koreans and percentage of population with a disability between the ages 34 and 64 in the United States with a correlation coefficient (R) of 0.056 and weighted average of 10.5%. Similarly, the statistical analysis conducted on geographies consisting of 354,876,335 people shows a moderate positive correlation between the proportion of Immigrants from Eastern Africa and percentage of population with a disability between the ages 34 and 64 in the United States with a correlation coefficient (R) of 0.439 and weighted average of 11.3%, a difference of 8.3%.
Disability Age 35 to 64 Correlation Summary
| Measurement | Korean | Immigrants from Eastern Africa |
| Minimum | 1.3% | 1.4% |
| Maximum | 25.7% | 34.6% |
| Range | 24.4% | 33.2% |
| Mean | 10.7% | 12.2% |
| Median | 9.6% | 11.0% |
| Interquartile 25% (IQ1) | 8.9% | 9.4% |
| Interquartile 75% (IQ3) | 11.2% | 13.6% |
| Interquartile Range (IQR) | 2.4% | 4.1% |
| Standard Deviation (Sample) | 3.9% | 5.7% |
| Standard Deviation (Population) | 3.8% | 5.6% |
Similar Demographics by Disability Age 35 to 64
Demographics Similar to Koreans by Disability Age 35 to 64
In terms of disability age 35 to 64, the demographic groups most similar to Koreans are Immigrants from Ethiopia (10.5%, a difference of 0.060%), Ethiopian (10.5%, a difference of 0.20%), Brazilian (10.5%, a difference of 0.20%), Zimbabwean (10.4%, a difference of 0.22%), and Assyrian/Chaldean/Syriac (10.5%, a difference of 0.24%).
| Demographics | Rating | Rank | Disability Age 35 to 64 |
| Immigrants | Ukraine | 97.9 /100 | #103 | Exceptional 10.4% |
| Immigrants | Austria | 97.8 /100 | #104 | Exceptional 10.4% |
| Macedonians | 97.8 /100 | #105 | Exceptional 10.4% |
| Immigrants | Hungary | 97.6 /100 | #106 | Exceptional 10.4% |
| Zimbabweans | 97.4 /100 | #107 | Exceptional 10.4% |
| Ethiopians | 97.4 /100 | #108 | Exceptional 10.5% |
| Immigrants | Ethiopia | 97.2 /100 | #109 | Exceptional 10.5% |
| Koreans | 97.1 /100 | #110 | Exceptional 10.5% |
| Brazilians | 96.9 /100 | #111 | Exceptional 10.5% |
| Assyrians/Chaldeans/Syriacs | 96.8 /100 | #112 | Exceptional 10.5% |
| Tongans | 96.6 /100 | #113 | Exceptional 10.5% |
| Immigrants | Morocco | 96.6 /100 | #114 | Exceptional 10.5% |
| Immigrants | Netherlands | 96.3 /100 | #115 | Exceptional 10.5% |
| Immigrants | Nepal | 95.9 /100 | #116 | Exceptional 10.6% |
| Immigrants | South Eastern Asia | 95.7 /100 | #117 | Exceptional 10.6% |
Demographics Similar to Immigrants from Eastern Africa by Disability Age 35 to 64
In terms of disability age 35 to 64, the demographic groups most similar to Immigrants from Eastern Africa are Polish (11.3%, a difference of 0.020%), Immigrants from Barbados (11.3%, a difference of 0.060%), Immigrants from Caribbean (11.3%, a difference of 0.060%), Ugandan (11.3%, a difference of 0.12%), and Trinidadian and Tobagonian (11.4%, a difference of 0.12%).
| Demographics | Rating | Rank | Disability Age 35 to 64 |
| Immigrants | Uganda | 58.0 /100 | #170 | Average 11.2% |
| Immigrants | Trinidad and Tobago | 55.9 /100 | #171 | Average 11.2% |
| Italians | 55.6 /100 | #172 | Average 11.2% |
| Lebanese | 51.8 /100 | #173 | Average 11.3% |
| Immigrants | Fiji | 50.0 /100 | #174 | Average 11.3% |
| Czechs | 47.9 /100 | #175 | Average 11.3% |
| Ugandans | 43.7 /100 | #176 | Average 11.3% |
| Immigrants | Eastern Africa | 42.2 /100 | #177 | Average 11.3% |
| Poles | 42.0 /100 | #178 | Average 11.3% |
| Immigrants | Barbados | 41.6 /100 | #179 | Average 11.3% |
| Immigrants | Caribbean | 41.5 /100 | #180 | Average 11.3% |
| Trinidadians and Tobagonians | 40.8 /100 | #181 | Average 11.4% |
| Icelanders | 39.7 /100 | #182 | Fair 11.4% |
| Immigrants | Oceania | 39.5 /100 | #183 | Fair 11.4% |
| Kenyans | 39.2 /100 | #184 | Fair 11.4% |