Immigrants from Indonesia vs Belgian Single Mother Households
COMPARE
Immigrants from Indonesia
Belgian
Single Mother Households
Single Mother Households Comparison
Immigrants from Indonesia
Belgians
5.7%
SINGLE MOTHER HOUSEHOLDS
97.2/ 100
METRIC RATING
90th/ 347
METRIC RANK
5.8%
SINGLE MOTHER HOUSEHOLDS
93.5/ 100
METRIC RATING
122nd/ 347
METRIC RANK
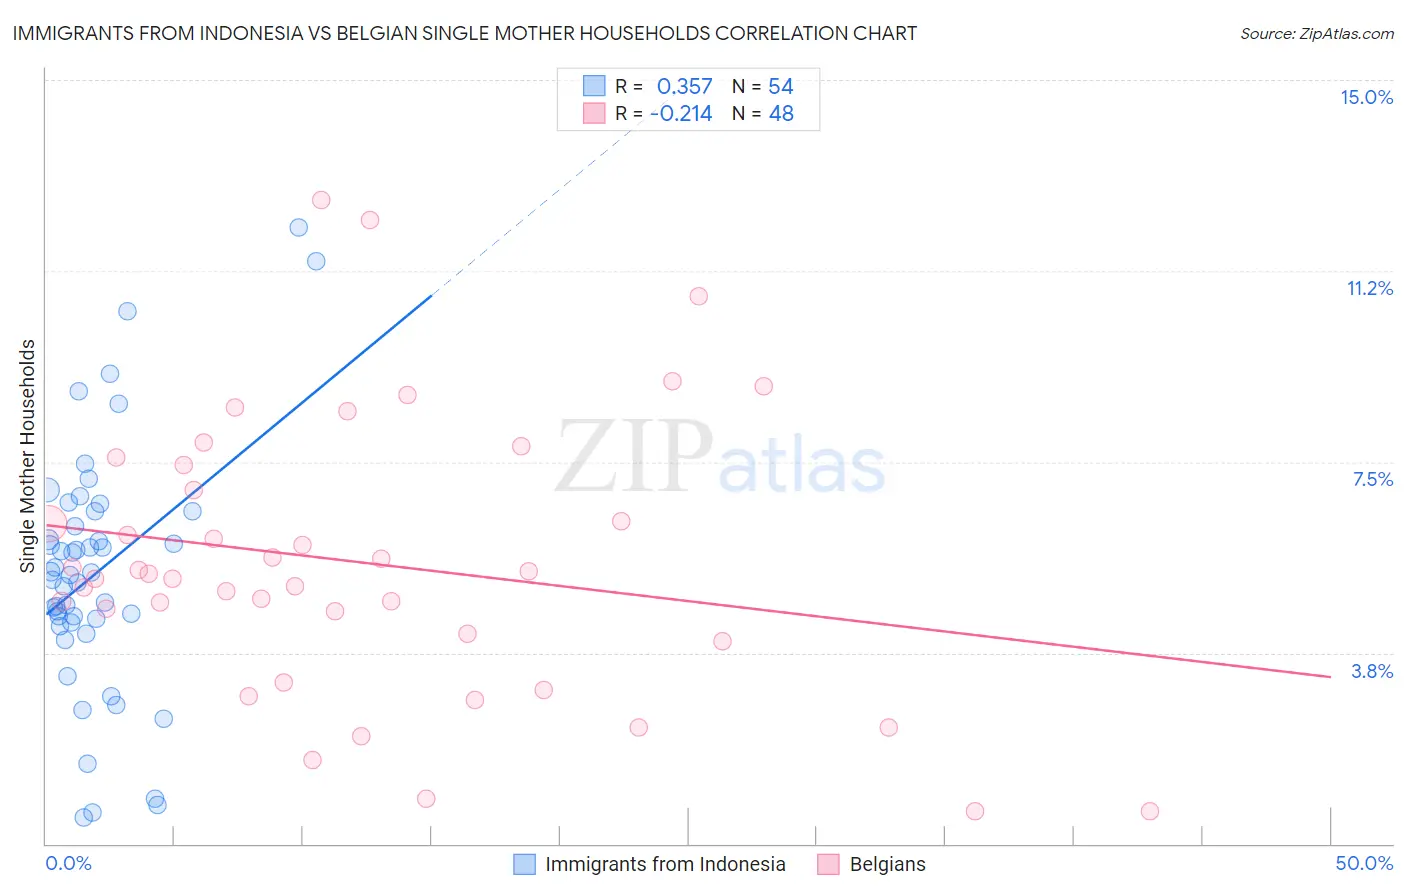
Immigrants from Indonesia vs Belgian Single Mother Households Correlation Chart
The statistical analysis conducted on geographies consisting of 215,530,702 people shows a mild positive correlation between the proportion of Immigrants from Indonesia and percentage of single mother households in the United States with a correlation coefficient (R) of 0.357 and weighted average of 5.7%. Similarly, the statistical analysis conducted on geographies consisting of 354,851,895 people shows a weak negative correlation between the proportion of Belgians and percentage of single mother households in the United States with a correlation coefficient (R) of -0.214 and weighted average of 5.8%, a difference of 2.6%.
Single Mother Households Correlation Summary
| Measurement | Immigrants from Indonesia | Belgian |
| Minimum | 0.52% | 0.64% |
| Maximum | 12.1% | 12.7% |
| Range | 11.6% | 12.0% |
| Mean | 5.3% | 5.5% |
| Median | 5.3% | 5.3% |
| Interquartile 25% (IQ1) | 4.3% | 4.0% |
| Interquartile 75% (IQ3) | 6.5% | 7.2% |
| Interquartile Range (IQR) | 2.2% | 3.2% |
| Standard Deviation (Sample) | 2.4% | 2.7% |
| Standard Deviation (Population) | 2.4% | 2.7% |
Similar Demographics by Single Mother Households
Demographics Similar to Immigrants from Indonesia by Single Mother Households
In terms of single mother households, the demographic groups most similar to Immigrants from Indonesia are Ukrainian (5.7%, a difference of 0.060%), European (5.7%, a difference of 0.22%), Israeli (5.7%, a difference of 0.32%), Immigrants from Turkey (5.7%, a difference of 0.39%), and Immigrants from Western Asia (5.7%, a difference of 0.45%).
| Demographics | Rating | Rank | Single Mother Households |
| Immigrants | Hungary | 97.8 /100 | #83 | Exceptional 5.7% |
| Carpatho Rusyns | 97.7 /100 | #84 | Exceptional 5.7% |
| Hungarians | 97.6 /100 | #85 | Exceptional 5.7% |
| Finns | 97.6 /100 | #86 | Exceptional 5.7% |
| Immigrants | Turkey | 97.5 /100 | #87 | Exceptional 5.7% |
| Israelis | 97.4 /100 | #88 | Exceptional 5.7% |
| Ukrainians | 97.2 /100 | #89 | Exceptional 5.7% |
| Immigrants | Indonesia | 97.2 /100 | #90 | Exceptional 5.7% |
| Europeans | 97.0 /100 | #91 | Exceptional 5.7% |
| Immigrants | Western Asia | 96.7 /100 | #92 | Exceptional 5.7% |
| Serbians | 96.7 /100 | #93 | Exceptional 5.7% |
| Basques | 96.7 /100 | #94 | Exceptional 5.7% |
| Slovaks | 96.6 /100 | #95 | Exceptional 5.7% |
| Austrians | 96.4 /100 | #96 | Exceptional 5.7% |
| Tlingit-Haida | 96.4 /100 | #97 | Exceptional 5.7% |
Demographics Similar to Belgians by Single Mother Households
In terms of single mother households, the demographic groups most similar to Belgians are Immigrants from Uzbekistan (5.9%, a difference of 0.060%), Argentinean (5.8%, a difference of 0.080%), Tongan (5.8%, a difference of 0.10%), Immigrants from Argentina (5.9%, a difference of 0.13%), and Slavic (5.9%, a difference of 0.29%).
| Demographics | Rating | Rank | Single Mother Households |
| Irish | 94.8 /100 | #115 | Exceptional 5.8% |
| Pennsylvania Germans | 94.7 /100 | #116 | Exceptional 5.8% |
| Bolivians | 94.6 /100 | #117 | Exceptional 5.8% |
| Laotians | 94.3 /100 | #118 | Exceptional 5.8% |
| South Africans | 94.1 /100 | #119 | Exceptional 5.8% |
| Tongans | 93.7 /100 | #120 | Exceptional 5.8% |
| Argentineans | 93.7 /100 | #121 | Exceptional 5.8% |
| Belgians | 93.5 /100 | #122 | Exceptional 5.8% |
| Immigrants | Uzbekistan | 93.4 /100 | #123 | Exceptional 5.9% |
| Immigrants | Argentina | 93.2 /100 | #124 | Exceptional 5.9% |
| Slavs | 92.9 /100 | #125 | Exceptional 5.9% |
| Welsh | 92.8 /100 | #126 | Exceptional 5.9% |
| Lebanese | 92.4 /100 | #127 | Exceptional 5.9% |
| Czechoslovakians | 92.2 /100 | #128 | Exceptional 5.9% |
| Immigrants | Bolivia | 92.2 /100 | #129 | Exceptional 5.9% |