Kiowa vs Scottish Divorced or Separated
COMPARE
Kiowa
Scottish
Divorced or Separated
Divorced or Separated Comparison
Kiowa
Scottish
14.5%
DIVORCED OR SEPARATED
0.0/ 100
METRIC RATING
345th/ 347
METRIC RANK
12.6%
DIVORCED OR SEPARATED
0.4/ 100
METRIC RATING
267th/ 347
METRIC RANK
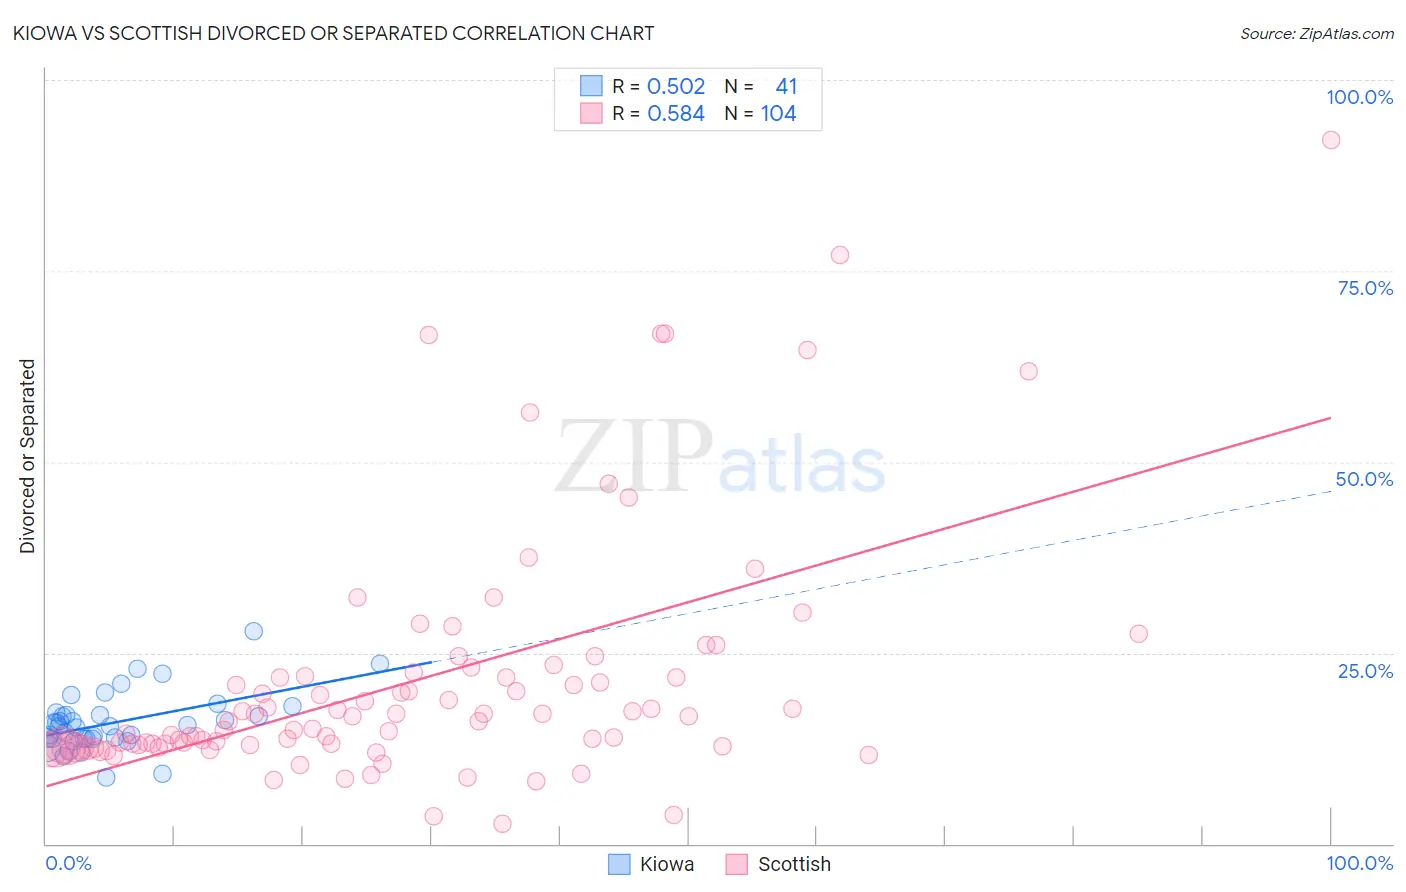
Kiowa vs Scottish Divorced or Separated Correlation Chart
The statistical analysis conducted on geographies consisting of 56,101,840 people shows a substantial positive correlation between the proportion of Kiowa and percentage of population currently divorced or separated in the United States with a correlation coefficient (R) of 0.502 and weighted average of 14.5%. Similarly, the statistical analysis conducted on geographies consisting of 566,665,399 people shows a substantial positive correlation between the proportion of Scottish and percentage of population currently divorced or separated in the United States with a correlation coefficient (R) of 0.584 and weighted average of 12.6%, a difference of 15.0%.
Divorced or Separated Correlation Summary
| Measurement | Kiowa | Scottish |
| Minimum | 8.7% | 2.6% |
| Maximum | 27.8% | 92.2% |
| Range | 19.1% | 89.6% |
| Mean | 15.9% | 21.2% |
| Median | 15.4% | 16.0% |
| Interquartile 25% (IQ1) | 13.8% | 12.8% |
| Interquartile 75% (IQ3) | 17.1% | 21.8% |
| Interquartile Range (IQR) | 3.3% | 9.1% |
| Standard Deviation (Sample) | 3.8% | 16.0% |
| Standard Deviation (Population) | 3.7% | 15.9% |
Similar Demographics by Divorced or Separated
Demographics Similar to Kiowa by Divorced or Separated
In terms of divorced or separated, the demographic groups most similar to Kiowa are Cuban (14.5%, a difference of 0.10%), Creek (14.4%, a difference of 0.77%), Seminole (14.3%, a difference of 1.8%), Bahamian (14.2%, a difference of 2.0%), and Arapaho (14.8%, a difference of 2.1%).
| Demographics | Rating | Rank | Divorced or Separated |
| Puerto Ricans | 0.0 /100 | #333 | Tragic 13.9% |
| Immigrants | Bahamas | 0.0 /100 | #334 | Tragic 13.9% |
| Dutch West Indians | 0.0 /100 | #335 | Tragic 14.0% |
| Shoshone | 0.0 /100 | #336 | Tragic 14.0% |
| Crow | 0.0 /100 | #337 | Tragic 14.1% |
| Choctaw | 0.0 /100 | #338 | Tragic 14.1% |
| Colville | 0.0 /100 | #339 | Tragic 14.2% |
| Chickasaw | 0.0 /100 | #340 | Tragic 14.2% |
| Bahamians | 0.0 /100 | #341 | Tragic 14.2% |
| Seminole | 0.0 /100 | #342 | Tragic 14.3% |
| Creek | 0.0 /100 | #343 | Tragic 14.4% |
| Cubans | 0.0 /100 | #344 | Tragic 14.5% |
| Kiowa | 0.0 /100 | #345 | Tragic 14.5% |
| Arapaho | 0.0 /100 | #346 | Tragic 14.8% |
| Immigrants | Cuba | 0.0 /100 | #347 | Tragic 15.2% |
Demographics Similar to Scottish by Divorced or Separated
In terms of divorced or separated, the demographic groups most similar to Scottish are Fijian (12.6%, a difference of 0.010%), Immigrants from Liberia (12.6%, a difference of 0.030%), White/Caucasian (12.6%, a difference of 0.040%), Immigrants from Senegal (12.6%, a difference of 0.050%), and English (12.6%, a difference of 0.070%).
| Demographics | Rating | Rank | Divorced or Separated |
| Immigrants | Uruguay | 0.6 /100 | #260 | Tragic 12.6% |
| Immigrants | Dominica | 0.5 /100 | #261 | Tragic 12.6% |
| Basques | 0.5 /100 | #262 | Tragic 12.6% |
| Immigrants | Panama | 0.5 /100 | #263 | Tragic 12.6% |
| English | 0.5 /100 | #264 | Tragic 12.6% |
| Immigrants | Senegal | 0.5 /100 | #265 | Tragic 12.6% |
| Whites/Caucasians | 0.5 /100 | #266 | Tragic 12.6% |
| Scottish | 0.4 /100 | #267 | Tragic 12.6% |
| Fijians | 0.4 /100 | #268 | Tragic 12.6% |
| Immigrants | Liberia | 0.4 /100 | #269 | Tragic 12.6% |
| Ute | 0.4 /100 | #270 | Tragic 12.6% |
| Panamanians | 0.3 /100 | #271 | Tragic 12.7% |
| Immigrants | Middle Africa | 0.3 /100 | #272 | Tragic 12.7% |
| Immigrants | Micronesia | 0.3 /100 | #273 | Tragic 12.7% |
| Bermudans | 0.3 /100 | #274 | Tragic 12.7% |