Kiowa vs Palestinian Median Female Earnings
COMPARE
Kiowa
Palestinian
Median Female Earnings
Median Female Earnings Comparison
Kiowa
Palestinians
$34,074
MEDIAN FEMALE EARNINGS
0.0/ 100
METRIC RATING
326th/ 347
METRIC RANK
$41,484
MEDIAN FEMALE EARNINGS
97.6/ 100
METRIC RATING
107th/ 347
METRIC RANK
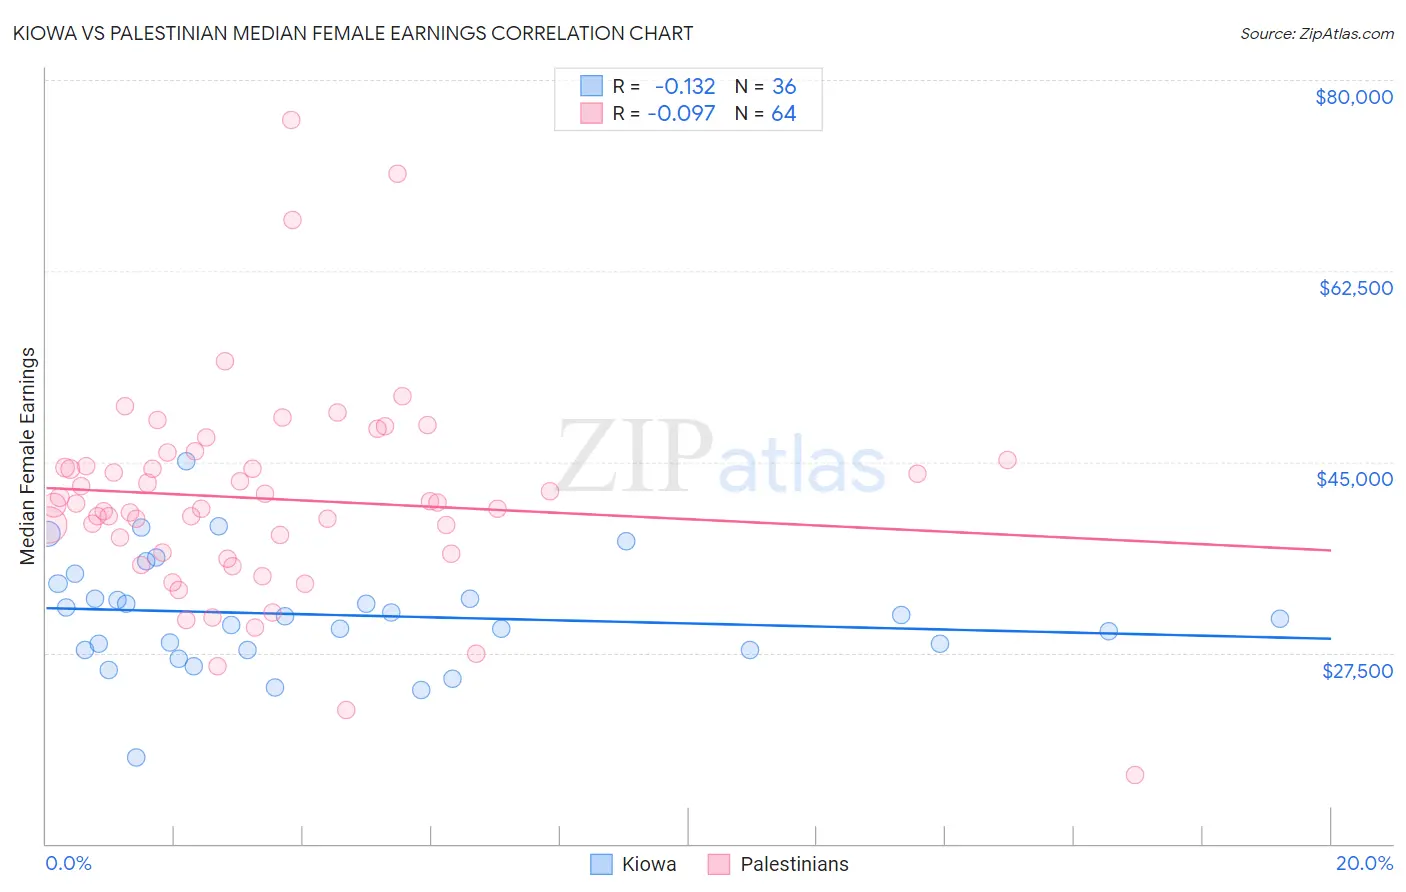
Kiowa vs Palestinian Median Female Earnings Correlation Chart
The statistical analysis conducted on geographies consisting of 56,093,569 people shows a poor negative correlation between the proportion of Kiowa and median female earnings in the United States with a correlation coefficient (R) of -0.132 and weighted average of $34,074. Similarly, the statistical analysis conducted on geographies consisting of 216,451,801 people shows a slight negative correlation between the proportion of Palestinians and median female earnings in the United States with a correlation coefficient (R) of -0.097 and weighted average of $41,484, a difference of 21.7%.
Median Female Earnings Correlation Summary
| Measurement | Kiowa | Palestinian |
| Minimum | $17,933 | $16,250 |
| Maximum | $45,071 | $76,295 |
| Range | $27,137 | $60,045 |
| Mean | $30,965 | $41,606 |
| Median | $30,714 | $41,078 |
| Interquartile 25% (IQ1) | $27,790 | $36,652 |
| Interquartile 75% (IQ3) | $33,181 | $44,886 |
| Interquartile Range (IQR) | $5,391 | $8,234 |
| Standard Deviation (Sample) | $5,151 | $9,677 |
| Standard Deviation (Population) | $5,079 | $9,602 |
Similar Demographics by Median Female Earnings
Demographics Similar to Kiowa by Median Female Earnings
In terms of median female earnings, the demographic groups most similar to Kiowa are Dutch West Indian ($34,106, a difference of 0.090%), Cajun ($34,034, a difference of 0.12%), Immigrants from Central America ($33,953, a difference of 0.36%), Hopi ($33,932, a difference of 0.42%), and Menominee ($33,894, a difference of 0.53%).
| Demographics | Rating | Rank | Median Female Earnings |
| Shoshone | 0.0 /100 | #319 | Tragic $34,677 |
| Immigrants | Honduras | 0.0 /100 | #320 | Tragic $34,647 |
| Hispanics or Latinos | 0.0 /100 | #321 | Tragic $34,421 |
| Chickasaw | 0.0 /100 | #322 | Tragic $34,414 |
| Seminole | 0.0 /100 | #323 | Tragic $34,385 |
| Immigrants | Congo | 0.0 /100 | #324 | Tragic $34,317 |
| Dutch West Indians | 0.0 /100 | #325 | Tragic $34,106 |
| Kiowa | 0.0 /100 | #326 | Tragic $34,074 |
| Cajuns | 0.0 /100 | #327 | Tragic $34,034 |
| Immigrants | Central America | 0.0 /100 | #328 | Tragic $33,953 |
| Hopi | 0.0 /100 | #329 | Tragic $33,932 |
| Menominee | 0.0 /100 | #330 | Tragic $33,894 |
| Natives/Alaskans | 0.0 /100 | #331 | Tragic $33,806 |
| Choctaw | 0.0 /100 | #332 | Tragic $33,775 |
| Mexicans | 0.0 /100 | #333 | Tragic $33,664 |
Demographics Similar to Palestinians by Median Female Earnings
In terms of median female earnings, the demographic groups most similar to Palestinians are Immigrants from Eritrea ($41,485, a difference of 0.0%), Italian ($41,505, a difference of 0.050%), Jordanian ($41,464, a difference of 0.050%), Chinese ($41,461, a difference of 0.050%), and Immigrants from Zimbabwe ($41,527, a difference of 0.10%).
| Demographics | Rating | Rank | Median Female Earnings |
| Romanians | 98.3 /100 | #100 | Exceptional $41,663 |
| Immigrants | Fiji | 98.3 /100 | #101 | Exceptional $41,656 |
| Immigrants | Poland | 98.2 /100 | #102 | Exceptional $41,630 |
| Immigrants | Argentina | 97.9 /100 | #103 | Exceptional $41,554 |
| Immigrants | Zimbabwe | 97.8 /100 | #104 | Exceptional $41,527 |
| Italians | 97.7 /100 | #105 | Exceptional $41,505 |
| Immigrants | Eritrea | 97.6 /100 | #106 | Exceptional $41,485 |
| Palestinians | 97.6 /100 | #107 | Exceptional $41,484 |
| Jordanians | 97.5 /100 | #108 | Exceptional $41,464 |
| Chinese | 97.5 /100 | #109 | Exceptional $41,461 |
| Immigrants | Western Asia | 97.0 /100 | #110 | Exceptional $41,375 |
| Immigrants | Canada | 97.0 /100 | #111 | Exceptional $41,373 |
| Immigrants | North America | 96.7 /100 | #112 | Exceptional $41,319 |
| Macedonians | 96.4 /100 | #113 | Exceptional $41,286 |
| Immigrants | England | 96.4 /100 | #114 | Exceptional $41,277 |