Immigrants from Eritrea vs Yuman Average Family Size
COMPARE
Immigrants from Eritrea
Yuman
Average Family Size
Average Family Size Comparison
Immigrants from Eritrea
Yuman
3.24
AVERAGE FAMILY SIZE
71.4/ 100
METRIC RATING
153rd/ 347
METRIC RANK
3.47
AVERAGE FAMILY SIZE
100.0/ 100
METRIC RATING
21st/ 347
METRIC RANK
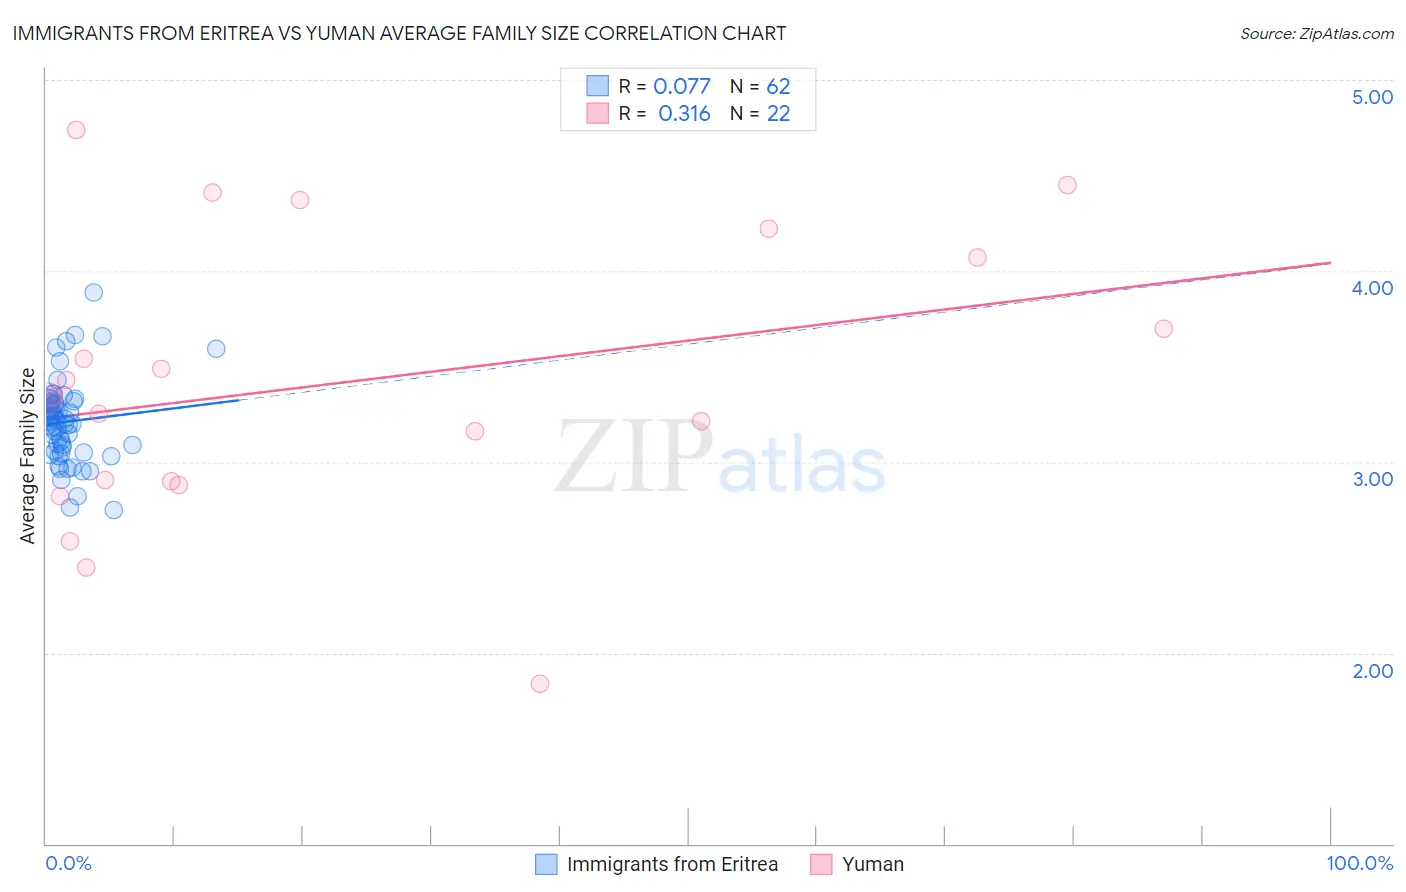
Immigrants from Eritrea vs Yuman Average Family Size Correlation Chart
The statistical analysis conducted on geographies consisting of 104,794,375 people shows a slight positive correlation between the proportion of Immigrants from Eritrea and average family size in the United States with a correlation coefficient (R) of 0.077 and weighted average of 3.24. Similarly, the statistical analysis conducted on geographies consisting of 40,663,604 people shows a mild positive correlation between the proportion of Yuman and average family size in the United States with a correlation coefficient (R) of 0.316 and weighted average of 3.47, a difference of 6.9%.
Average Family Size Correlation Summary
| Measurement | Immigrants from Eritrea | Yuman |
| Minimum | 2.75 | 1.84 |
| Maximum | 3.89 | 4.74 |
| Range | 1.14 | 2.90 |
| Mean | 3.21 | 3.41 |
| Median | 3.21 | 3.33 |
| Interquartile 25% (IQ1) | 3.05 | 2.90 |
| Interquartile 75% (IQ3) | 3.31 | 4.07 |
| Interquartile Range (IQR) | 0.25 | 1.17 |
| Standard Deviation (Sample) | 0.22 | 0.73 |
| Standard Deviation (Population) | 0.22 | 0.72 |
Similar Demographics by Average Family Size
Demographics Similar to Immigrants from Eritrea by Average Family Size
In terms of average family size, the demographic groups most similar to Immigrants from Eritrea are Spanish American (3.24, a difference of 0.020%), Immigrants from Egypt (3.24, a difference of 0.030%), Assyrian/Chaldean/Syriac (3.24, a difference of 0.050%), Indian (Asian) (3.24, a difference of 0.050%), and Jordanian (3.24, a difference of 0.050%).
| Demographics | Rating | Rank | Average Family Size |
| Immigrants | Africa | 77.9 /100 | #146 | Good 3.25 |
| Immigrants | Jordan | 75.7 /100 | #147 | Good 3.24 |
| Blackfeet | 75.0 /100 | #148 | Good 3.24 |
| Assyrians/Chaldeans/Syriacs | 73.8 /100 | #149 | Good 3.24 |
| Indians (Asian) | 73.6 /100 | #150 | Good 3.24 |
| Jordanians | 73.5 /100 | #151 | Good 3.24 |
| Spanish Americans | 72.5 /100 | #152 | Good 3.24 |
| Immigrants | Eritrea | 71.4 /100 | #153 | Good 3.24 |
| Immigrants | Egypt | 70.0 /100 | #154 | Good 3.24 |
| Seminole | 68.2 /100 | #155 | Good 3.24 |
| Immigrants | Taiwan | 68.1 /100 | #156 | Good 3.24 |
| Immigrants | Uzbekistan | 67.0 /100 | #157 | Good 3.24 |
| Iraqis | 64.3 /100 | #158 | Good 3.24 |
| Ethiopians | 63.9 /100 | #159 | Good 3.24 |
| Immigrants | Iraq | 63.7 /100 | #160 | Good 3.24 |
Demographics Similar to Yuman by Average Family Size
In terms of average family size, the demographic groups most similar to Yuman are Apache (3.46, a difference of 0.060%), Cheyenne (3.47, a difference of 0.25%), Mexican (3.48, a difference of 0.30%), Immigrants from Fiji (3.45, a difference of 0.35%), and Salvadoran (3.48, a difference of 0.36%).
| Demographics | Rating | Rank | Average Family Size |
| Immigrants | Central America | 100.0 /100 | #14 | Exceptional 3.49 |
| Tongans | 100.0 /100 | #15 | Exceptional 3.49 |
| Ute | 100.0 /100 | #16 | Exceptional 3.49 |
| Immigrants | El Salvador | 100.0 /100 | #17 | Exceptional 3.49 |
| Salvadorans | 100.0 /100 | #18 | Exceptional 3.48 |
| Mexicans | 100.0 /100 | #19 | Exceptional 3.48 |
| Cheyenne | 100.0 /100 | #20 | Exceptional 3.47 |
| Yuman | 100.0 /100 | #21 | Exceptional 3.47 |
| Apache | 100.0 /100 | #22 | Exceptional 3.46 |
| Immigrants | Fiji | 100.0 /100 | #23 | Exceptional 3.45 |
| Natives/Alaskans | 100.0 /100 | #24 | Exceptional 3.45 |
| Yakama | 100.0 /100 | #25 | Exceptional 3.45 |
| Native Hawaiians | 100.0 /100 | #26 | Exceptional 3.43 |
| Mexican American Indians | 100.0 /100 | #27 | Exceptional 3.43 |
| Immigrants | Latin America | 100.0 /100 | #28 | Exceptional 3.42 |