Icelander vs Immigrants from Spain Average Family Size
COMPARE
Icelander
Immigrants from Spain
Average Family Size
Average Family Size Comparison
Icelanders
Immigrants from Spain
3.19
AVERAGE FAMILY SIZE
5.2/ 100
METRIC RATING
230th/ 347
METRIC RANK
3.17
AVERAGE FAMILY SIZE
1.8/ 100
METRIC RATING
251st/ 347
METRIC RANK
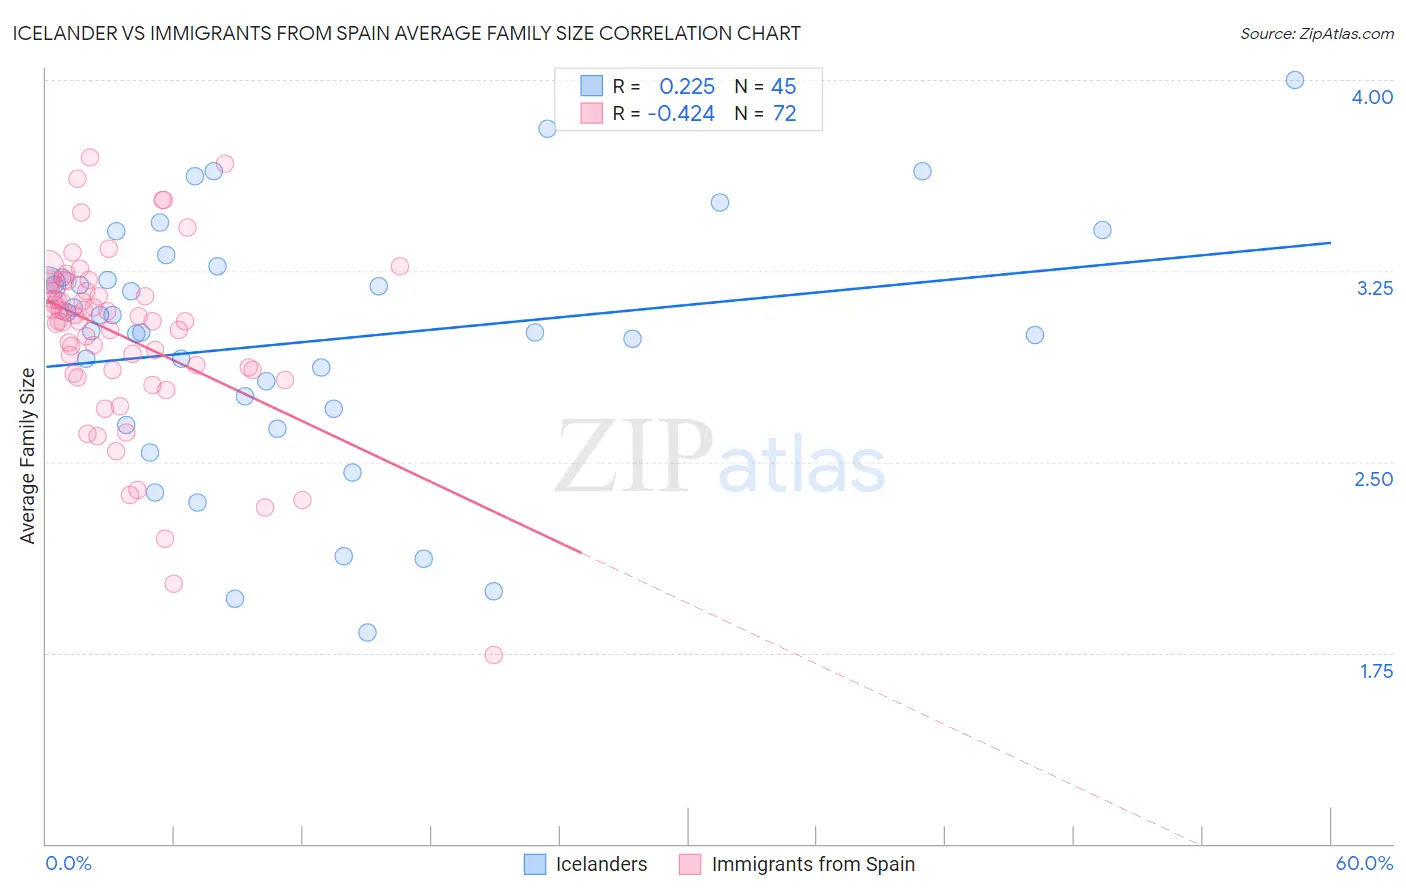
Icelander vs Immigrants from Spain Average Family Size Correlation Chart
The statistical analysis conducted on geographies consisting of 159,626,444 people shows a weak positive correlation between the proportion of Icelanders and average family size in the United States with a correlation coefficient (R) of 0.225 and weighted average of 3.19. Similarly, the statistical analysis conducted on geographies consisting of 239,606,495 people shows a moderate negative correlation between the proportion of Immigrants from Spain and average family size in the United States with a correlation coefficient (R) of -0.424 and weighted average of 3.17, a difference of 0.50%.
Average Family Size Correlation Summary
| Measurement | Icelander | Immigrants from Spain |
| Minimum | 1.83 | 1.74 |
| Maximum | 4.00 | 3.70 |
| Range | 2.17 | 1.96 |
| Mean | 2.97 | 2.99 |
| Median | 3.02 | 3.05 |
| Interquartile 25% (IQ1) | 2.68 | 2.85 |
| Interquartile 75% (IQ3) | 3.25 | 3.19 |
| Interquartile Range (IQR) | 0.57 | 0.33 |
| Standard Deviation (Sample) | 0.50 | 0.36 |
| Standard Deviation (Population) | 0.49 | 0.36 |
Similar Demographics by Average Family Size
Demographics Similar to Icelanders by Average Family Size
In terms of average family size, the demographic groups most similar to Icelanders are Basque (3.19, a difference of 0.0%), Immigrants from Italy (3.19, a difference of 0.010%), Cherokee (3.18, a difference of 0.040%), Nonimmigrants (3.19, a difference of 0.050%), and Portuguese (3.19, a difference of 0.070%).
| Demographics | Rating | Rank | Average Family Size |
| Immigrants | Zimbabwe | 7.1 /100 | #223 | Tragic 3.19 |
| Syrians | 6.5 /100 | #224 | Tragic 3.19 |
| Cree | 6.2 /100 | #225 | Tragic 3.19 |
| Chickasaw | 6.0 /100 | #226 | Tragic 3.19 |
| Portuguese | 6.0 /100 | #227 | Tragic 3.19 |
| Immigrants | Nonimmigrants | 5.7 /100 | #228 | Tragic 3.19 |
| Immigrants | Italy | 5.3 /100 | #229 | Tragic 3.19 |
| Icelanders | 5.2 /100 | #230 | Tragic 3.19 |
| Basques | 5.2 /100 | #231 | Tragic 3.19 |
| Cherokee | 4.7 /100 | #232 | Tragic 3.18 |
| Brazilians | 4.5 /100 | #233 | Tragic 3.18 |
| Iranians | 4.5 /100 | #234 | Tragic 3.18 |
| Immigrants | Turkey | 4.2 /100 | #235 | Tragic 3.18 |
| Immigrants | Portugal | 4.2 /100 | #236 | Tragic 3.18 |
| Immigrants | Romania | 3.7 /100 | #237 | Tragic 3.18 |
Demographics Similar to Immigrants from Spain by Average Family Size
In terms of average family size, the demographic groups most similar to Immigrants from Spain are Puget Sound Salish (3.17, a difference of 0.010%), Immigrants from Saudi Arabia (3.17, a difference of 0.030%), South African (3.17, a difference of 0.030%), Immigrants from Hungary (3.17, a difference of 0.040%), and Cape Verdean (3.17, a difference of 0.050%).
| Demographics | Rating | Rank | Average Family Size |
| Immigrants | Southern Europe | 2.9 /100 | #244 | Tragic 3.18 |
| Immigrants | Brazil | 2.7 /100 | #245 | Tragic 3.18 |
| Danes | 2.5 /100 | #246 | Tragic 3.17 |
| Cajuns | 2.4 /100 | #247 | Tragic 3.17 |
| Immigrants | Belarus | 2.3 /100 | #248 | Tragic 3.17 |
| Immigrants | Eastern Europe | 2.1 /100 | #249 | Tragic 3.17 |
| Puget Sound Salish | 1.9 /100 | #250 | Tragic 3.17 |
| Immigrants | Spain | 1.8 /100 | #251 | Tragic 3.17 |
| Immigrants | Saudi Arabia | 1.7 /100 | #252 | Tragic 3.17 |
| South Africans | 1.7 /100 | #253 | Tragic 3.17 |
| Immigrants | Hungary | 1.7 /100 | #254 | Tragic 3.17 |
| Cape Verdeans | 1.6 /100 | #255 | Tragic 3.17 |
| Immigrants | Kazakhstan | 1.5 /100 | #256 | Tragic 3.17 |
| Albanians | 1.5 /100 | #257 | Tragic 3.17 |
| Turks | 1.3 /100 | #258 | Tragic 3.16 |