Israeli vs Immigrants from Uruguay Family Households
COMPARE
Israeli
Immigrants from Uruguay
Family Households
Family Households Comparison
Israelis
Immigrants from Uruguay
63.1%
FAMILY HOUSEHOLDS
0.4/ 100
METRIC RATING
267th/ 347
METRIC RANK
63.9%
FAMILY HOUSEHOLDS
12.8/ 100
METRIC RATING
204th/ 347
METRIC RANK
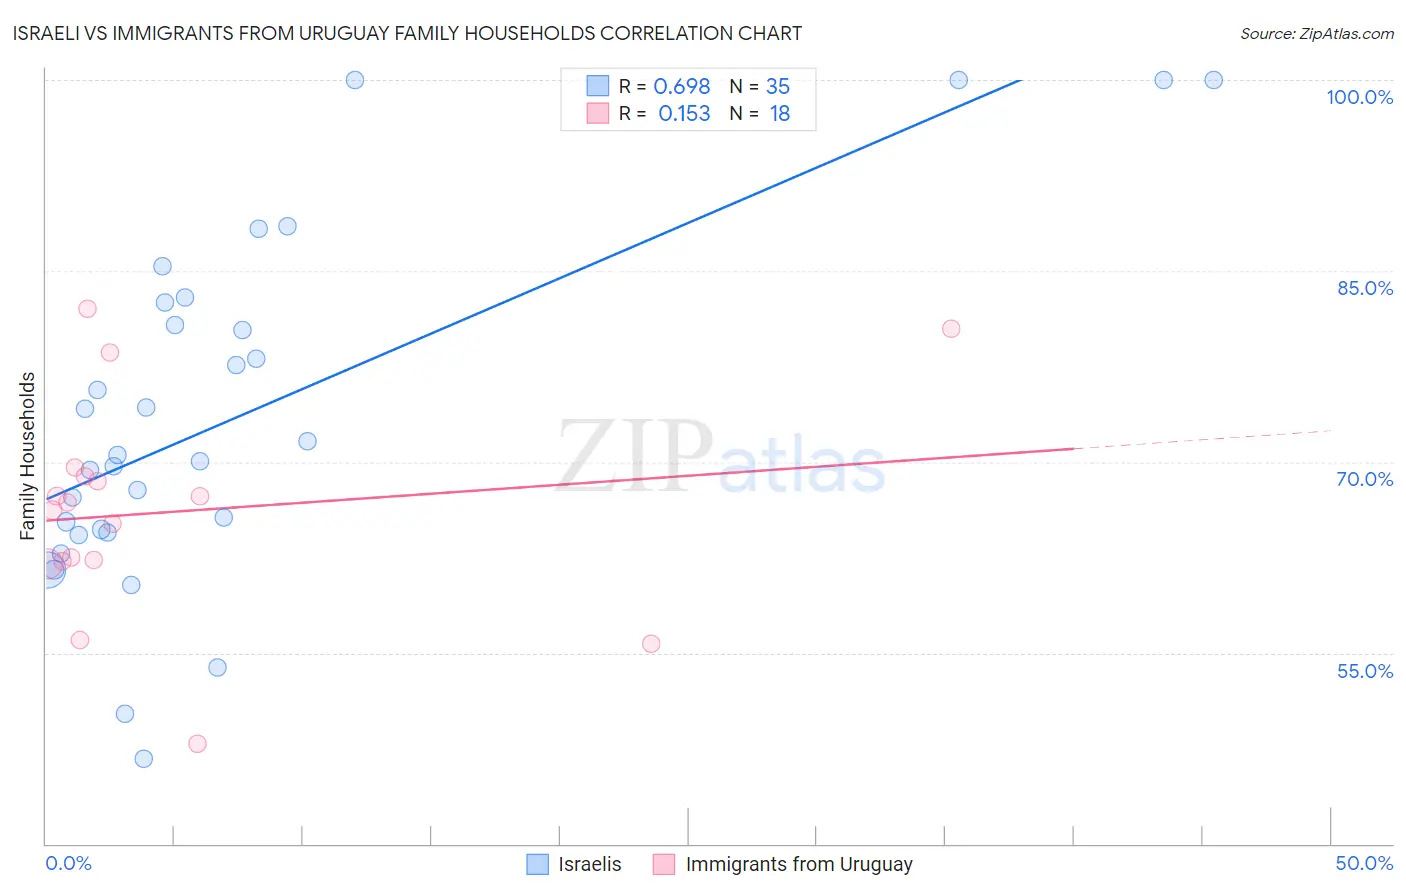
Israeli vs Immigrants from Uruguay Family Households Correlation Chart
The statistical analysis conducted on geographies consisting of 210,999,520 people shows a significant positive correlation between the proportion of Israelis and percentage of family households in the United States with a correlation coefficient (R) of 0.698 and weighted average of 63.1%. Similarly, the statistical analysis conducted on geographies consisting of 133,245,142 people shows a poor positive correlation between the proportion of Immigrants from Uruguay and percentage of family households in the United States with a correlation coefficient (R) of 0.153 and weighted average of 63.9%, a difference of 1.2%.
Family Households Correlation Summary
| Measurement | Israeli | Immigrants from Uruguay |
| Minimum | 46.6% | 47.9% |
| Maximum | 100.0% | 82.0% |
| Range | 53.4% | 34.1% |
| Mean | 73.6% | 66.1% |
| Median | 70.5% | 66.5% |
| Interquartile 25% (IQ1) | 64.4% | 62.2% |
| Interquartile 75% (IQ3) | 82.5% | 68.9% |
| Interquartile Range (IQR) | 18.1% | 6.7% |
| Standard Deviation (Sample) | 13.8% | 8.6% |
| Standard Deviation (Population) | 13.6% | 8.3% |
Similar Demographics by Family Households
Demographics Similar to Israelis by Family Households
In terms of family households, the demographic groups most similar to Israelis are Immigrants from Western Africa (63.1%, a difference of 0.040%), Colville (63.2%, a difference of 0.050%), Immigrants from Singapore (63.1%, a difference of 0.050%), Cheyenne (63.2%, a difference of 0.060%), and Kenyan (63.2%, a difference of 0.060%).
| Demographics | Rating | Rank | Family Households |
| Cypriots | 0.6 /100 | #260 | Tragic 63.2% |
| Immigrants | Russia | 0.6 /100 | #261 | Tragic 63.2% |
| Immigrants | Ireland | 0.6 /100 | #262 | Tragic 63.2% |
| Cheyenne | 0.5 /100 | #263 | Tragic 63.2% |
| Kenyans | 0.5 /100 | #264 | Tragic 63.2% |
| Colville | 0.5 /100 | #265 | Tragic 63.2% |
| Immigrants | Western Africa | 0.5 /100 | #266 | Tragic 63.1% |
| Israelis | 0.4 /100 | #267 | Tragic 63.1% |
| Immigrants | Singapore | 0.4 /100 | #268 | Tragic 63.1% |
| Yugoslavians | 0.4 /100 | #269 | Tragic 63.1% |
| Immigrants | Austria | 0.3 /100 | #270 | Tragic 63.1% |
| Immigrants | Croatia | 0.3 /100 | #271 | Tragic 63.1% |
| Immigrants | Turkey | 0.3 /100 | #272 | Tragic 63.1% |
| Immigrants | Kazakhstan | 0.3 /100 | #273 | Tragic 63.1% |
| Lumbee | 0.3 /100 | #274 | Tragic 63.1% |
Demographics Similar to Immigrants from Uruguay by Family Households
In terms of family households, the demographic groups most similar to Immigrants from Uruguay are Norwegian (63.9%, a difference of 0.010%), Brazilian (63.9%, a difference of 0.010%), Iranian (63.9%, a difference of 0.020%), Immigrants from Lithuania (63.9%, a difference of 0.020%), and Nigerian (63.9%, a difference of 0.040%).
| Demographics | Rating | Rank | Family Households |
| Seminole | 18.9 /100 | #197 | Poor 64.0% |
| Poles | 18.9 /100 | #198 | Poor 64.0% |
| Slavs | 18.6 /100 | #199 | Poor 64.0% |
| Immigrants | Malaysia | 17.9 /100 | #200 | Poor 64.0% |
| Immigrants | Eastern Europe | 17.2 /100 | #201 | Poor 64.0% |
| Iranians | 13.5 /100 | #202 | Poor 63.9% |
| Norwegians | 13.2 /100 | #203 | Poor 63.9% |
| Immigrants | Uruguay | 12.8 /100 | #204 | Poor 63.9% |
| Brazilians | 12.4 /100 | #205 | Poor 63.9% |
| Immigrants | Lithuania | 12.1 /100 | #206 | Poor 63.9% |
| Nigerians | 11.5 /100 | #207 | Poor 63.9% |
| Immigrants | Bangladesh | 11.4 /100 | #208 | Poor 63.9% |
| Sierra Leoneans | 11.2 /100 | #209 | Poor 63.9% |
| Immigrants | Thailand | 9.6 /100 | #210 | Tragic 63.8% |
| Shoshone | 9.4 /100 | #211 | Tragic 63.8% |