Israeli vs Immigrants from Cabo Verde Seniors Poverty Over the Age of 65
COMPARE
Israeli
Immigrants from Cabo Verde
Seniors Poverty Over the Age of 65
Seniors Poverty Over the Age of 65 Comparison
Israelis
Immigrants from Cabo Verde
11.3%
SENIORS POVERTY OVER THE AGE OF 65
16.5/ 100
METRIC RATING
204th/ 347
METRIC RANK
16.2%
SENIORS POVERTY OVER THE AGE OF 65
0.0/ 100
METRIC RATING
336th/ 347
METRIC RANK
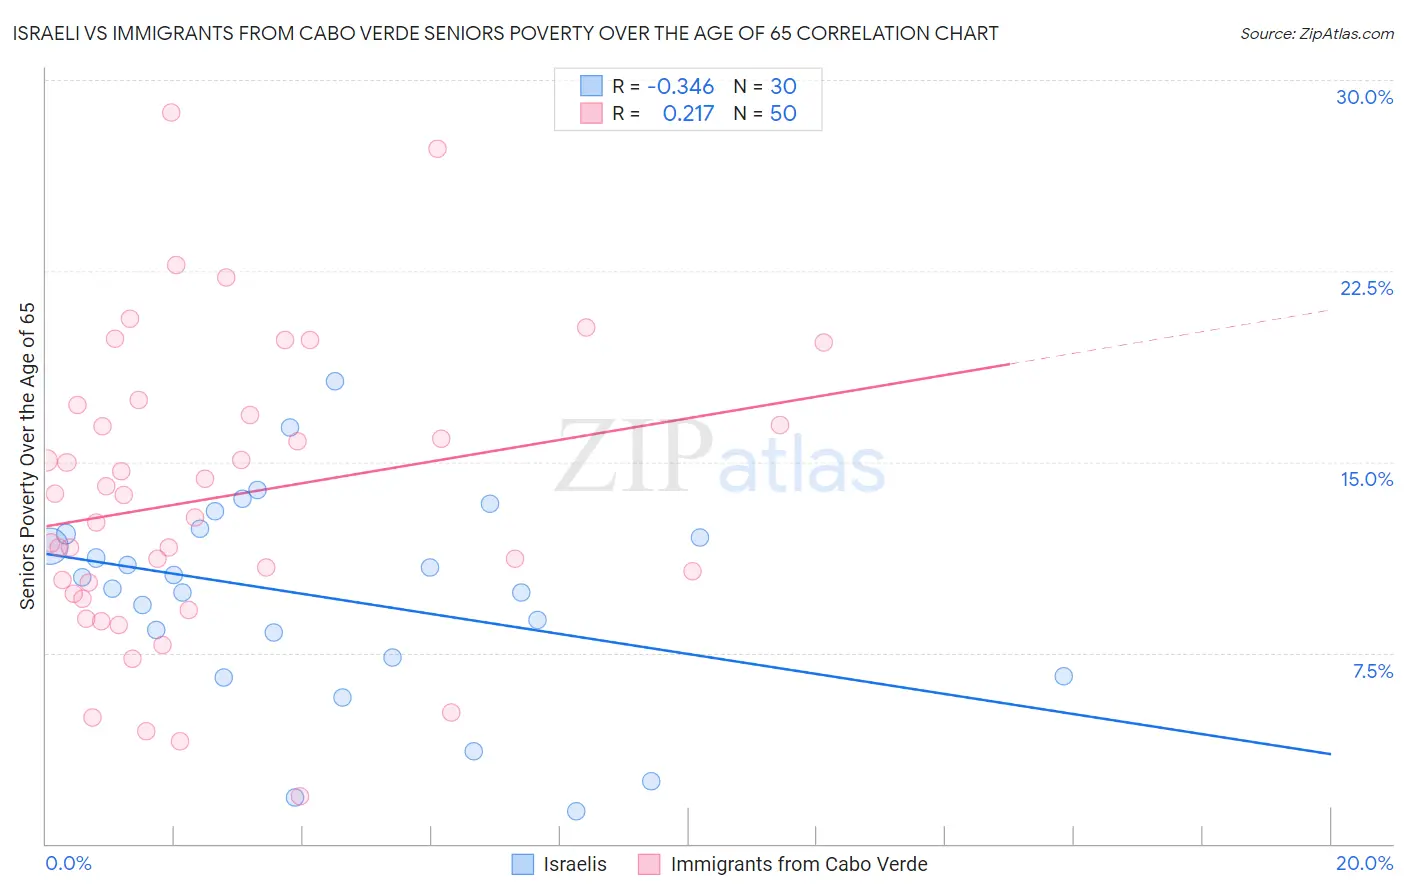
Israeli vs Immigrants from Cabo Verde Seniors Poverty Over the Age of 65 Correlation Chart
The statistical analysis conducted on geographies consisting of 210,589,570 people shows a mild negative correlation between the proportion of Israelis and poverty level among seniors over the age of 65 in the United States with a correlation coefficient (R) of -0.346 and weighted average of 11.3%. Similarly, the statistical analysis conducted on geographies consisting of 38,086,580 people shows a weak positive correlation between the proportion of Immigrants from Cabo Verde and poverty level among seniors over the age of 65 in the United States with a correlation coefficient (R) of 0.217 and weighted average of 16.2%, a difference of 43.0%.
Seniors Poverty Over the Age of 65 Correlation Summary
| Measurement | Israeli | Immigrants from Cabo Verde |
| Minimum | 1.3% | 1.9% |
| Maximum | 18.2% | 28.7% |
| Range | 16.9% | 26.9% |
| Mean | 9.7% | 13.6% |
| Median | 10.2% | 13.3% |
| Interquartile 25% (IQ1) | 7.3% | 9.8% |
| Interquartile 75% (IQ3) | 12.2% | 16.9% |
| Interquartile Range (IQR) | 4.9% | 7.1% |
| Standard Deviation (Sample) | 4.0% | 5.7% |
| Standard Deviation (Population) | 4.0% | 5.7% |
Similar Demographics by Seniors Poverty Over the Age of 65
Demographics Similar to Israelis by Seniors Poverty Over the Age of 65
In terms of seniors poverty over the age of 65, the demographic groups most similar to Israelis are Immigrants from Zaire (11.3%, a difference of 0.070%), Costa Rican (11.3%, a difference of 0.080%), Brazilian (11.3%, a difference of 0.18%), Immigrants from Brazil (11.3%, a difference of 0.19%), and Choctaw (11.4%, a difference of 0.32%).
| Demographics | Rating | Rank | Seniors Poverty Over the Age of 65 |
| Albanians | 24.4 /100 | #197 | Fair 11.2% |
| Immigrants | Burma/Myanmar | 21.3 /100 | #198 | Fair 11.3% |
| Immigrants | Israel | 20.3 /100 | #199 | Fair 11.3% |
| Alsatians | 20.1 /100 | #200 | Fair 11.3% |
| Immigrants | Brazil | 17.8 /100 | #201 | Poor 11.3% |
| Costa Ricans | 17.0 /100 | #202 | Poor 11.3% |
| Immigrants | Zaire | 16.9 /100 | #203 | Poor 11.3% |
| Israelis | 16.5 /100 | #204 | Poor 11.3% |
| Brazilians | 15.4 /100 | #205 | Poor 11.3% |
| Choctaw | 14.5 /100 | #206 | Poor 11.4% |
| Immigrants | Western Asia | 13.6 /100 | #207 | Poor 11.4% |
| South American Indians | 11.7 /100 | #208 | Poor 11.4% |
| Paraguayans | 11.3 /100 | #209 | Poor 11.4% |
| Ugandans | 11.2 /100 | #210 | Poor 11.4% |
| Indonesians | 10.4 /100 | #211 | Poor 11.5% |
Demographics Similar to Immigrants from Cabo Verde by Seniors Poverty Over the Age of 65
In terms of seniors poverty over the age of 65, the demographic groups most similar to Immigrants from Cabo Verde are Cuban (16.1%, a difference of 0.57%), Immigrants from Nicaragua (15.9%, a difference of 1.8%), Immigrants from Caribbean (16.5%, a difference of 1.8%), Immigrants from Yemen (15.9%, a difference of 2.0%), and Immigrants from Grenada (15.8%, a difference of 2.4%).
| Demographics | Rating | Rank | Seniors Poverty Over the Age of 65 |
| Immigrants | Dominica | 0.0 /100 | #329 | Tragic 15.5% |
| Immigrants | St. Vincent and the Grenadines | 0.0 /100 | #330 | Tragic 15.5% |
| British West Indians | 0.0 /100 | #331 | Tragic 15.6% |
| Immigrants | Grenada | 0.0 /100 | #332 | Tragic 15.8% |
| Immigrants | Yemen | 0.0 /100 | #333 | Tragic 15.9% |
| Immigrants | Nicaragua | 0.0 /100 | #334 | Tragic 15.9% |
| Cubans | 0.0 /100 | #335 | Tragic 16.1% |
| Immigrants | Cabo Verde | 0.0 /100 | #336 | Tragic 16.2% |
| Immigrants | Caribbean | 0.0 /100 | #337 | Tragic 16.5% |
| Pueblo | 0.0 /100 | #338 | Tragic 17.2% |
| Navajo | 0.0 /100 | #339 | Tragic 17.5% |
| Hopi | 0.0 /100 | #340 | Tragic 17.8% |
| Dominicans | 0.0 /100 | #341 | Tragic 17.8% |
| Immigrants | Cuba | 0.0 /100 | #342 | Tragic 17.9% |
| Lumbee | 0.0 /100 | #343 | Tragic 18.1% |