Moroccan vs Nonimmigrants Family Households
COMPARE
Moroccan
Nonimmigrants
Family Households
Family Households Comparison
Moroccans
Nonimmigrants
61.9%
FAMILY HOUSEHOLDS
0.0/ 100
METRIC RATING
315th/ 347
METRIC RANK
64.8%
FAMILY HOUSEHOLDS
90.1/ 100
METRIC RATING
131st/ 347
METRIC RANK
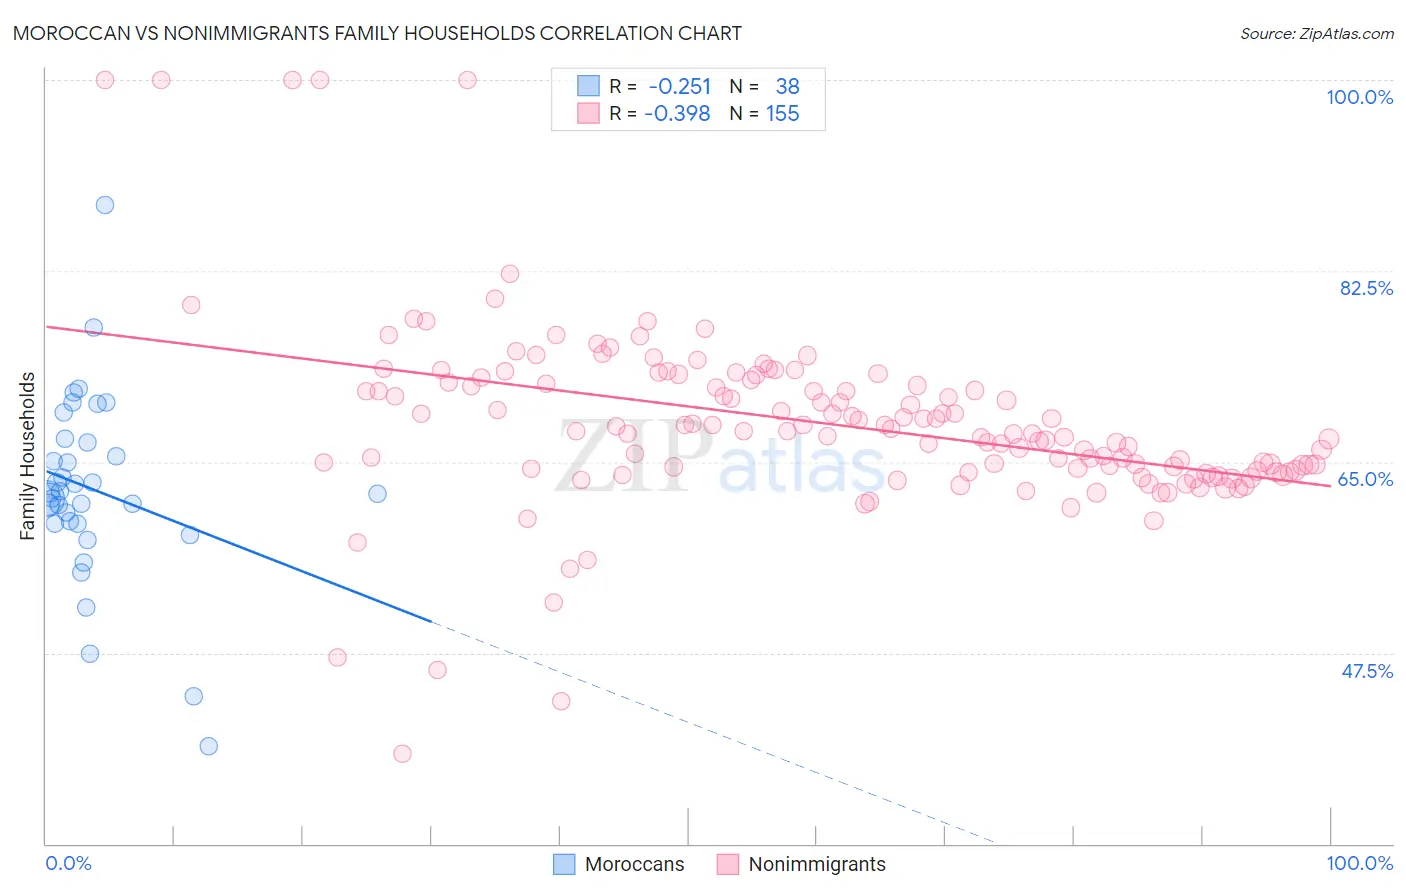
Moroccan vs Nonimmigrants Family Households Correlation Chart
The statistical analysis conducted on geographies consisting of 201,760,179 people shows a weak negative correlation between the proportion of Moroccans and percentage of family households in the United States with a correlation coefficient (R) of -0.251 and weighted average of 61.9%. Similarly, the statistical analysis conducted on geographies consisting of 584,651,779 people shows a mild negative correlation between the proportion of Nonimmigrants and percentage of family households in the United States with a correlation coefficient (R) of -0.398 and weighted average of 64.8%, a difference of 4.6%.
Family Households Correlation Summary
| Measurement | Moroccan | Nonimmigrants |
| Minimum | 38.9% | 38.2% |
| Maximum | 88.5% | 100.0% |
| Range | 49.6% | 61.8% |
| Mean | 62.4% | 68.5% |
| Median | 62.1% | 67.8% |
| Interquartile 25% (IQ1) | 59.3% | 64.2% |
| Interquartile 75% (IQ3) | 66.7% | 72.3% |
| Interquartile Range (IQR) | 7.4% | 8.1% |
| Standard Deviation (Sample) | 8.7% | 8.6% |
| Standard Deviation (Population) | 8.6% | 8.6% |
Similar Demographics by Family Households
Demographics Similar to Moroccans by Family Households
In terms of family households, the demographic groups most similar to Moroccans are Immigrants from Cabo Verde (61.9%, a difference of 0.040%), Immigrants from Middle Africa (61.9%, a difference of 0.040%), Immigrants from Bosnia and Herzegovina (61.9%, a difference of 0.080%), Liberian (62.0%, a difference of 0.090%), and Immigrants from Latvia (62.0%, a difference of 0.10%).
| Demographics | Rating | Rank | Family Households |
| Chippewa | 0.0 /100 | #308 | Tragic 62.1% |
| Sub-Saharan Africans | 0.0 /100 | #309 | Tragic 62.1% |
| Immigrants | Liberia | 0.0 /100 | #310 | Tragic 62.0% |
| Immigrants | Morocco | 0.0 /100 | #311 | Tragic 62.0% |
| Immigrants | Latvia | 0.0 /100 | #312 | Tragic 62.0% |
| Liberians | 0.0 /100 | #313 | Tragic 62.0% |
| Immigrants | Cabo Verde | 0.0 /100 | #314 | Tragic 61.9% |
| Moroccans | 0.0 /100 | #315 | Tragic 61.9% |
| Immigrants | Middle Africa | 0.0 /100 | #316 | Tragic 61.9% |
| Immigrants | Bosnia and Herzegovina | 0.0 /100 | #317 | Tragic 61.9% |
| Alaskan Athabascans | 0.0 /100 | #318 | Tragic 61.8% |
| Cape Verdeans | 0.0 /100 | #319 | Tragic 61.8% |
| Ugandans | 0.0 /100 | #320 | Tragic 61.7% |
| Alsatians | 0.0 /100 | #321 | Tragic 61.7% |
| Immigrants | Serbia | 0.0 /100 | #322 | Tragic 61.6% |
Demographics Similar to Nonimmigrants by Family Households
In terms of family households, the demographic groups most similar to Nonimmigrants are Immigrants from Italy (64.8%, a difference of 0.010%), Cajun (64.8%, a difference of 0.020%), Belizean (64.8%, a difference of 0.030%), Immigrants from Ecuador (64.8%, a difference of 0.050%), and Italian (64.8%, a difference of 0.070%).
| Demographics | Rating | Rank | Family Households |
| Immigrants | Argentina | 92.8 /100 | #124 | Exceptional 64.9% |
| Immigrants | Belize | 92.7 /100 | #125 | Exceptional 64.9% |
| Panamanians | 92.4 /100 | #126 | Exceptional 64.8% |
| Immigrants | Panama | 92.0 /100 | #127 | Exceptional 64.8% |
| Italians | 91.9 /100 | #128 | Exceptional 64.8% |
| Immigrants | Ecuador | 91.4 /100 | #129 | Exceptional 64.8% |
| Immigrants | Italy | 90.2 /100 | #130 | Exceptional 64.8% |
| Immigrants | Nonimmigrants | 90.1 /100 | #131 | Exceptional 64.8% |
| Cajuns | 89.4 /100 | #132 | Excellent 64.8% |
| Belizeans | 89.3 /100 | #133 | Excellent 64.8% |
| Greeks | 88.1 /100 | #134 | Excellent 64.7% |
| Maltese | 87.4 /100 | #135 | Excellent 64.7% |
| Immigrants | China | 86.6 /100 | #136 | Excellent 64.7% |
| Immigrants | Scotland | 86.4 /100 | #137 | Excellent 64.7% |
| Basques | 85.5 /100 | #138 | Excellent 64.7% |