Immigrants from India vs Immigrants from Korea Family Households
COMPARE
Immigrants from India
Immigrants from Korea
Family Households
Family Households Comparison
Immigrants from India
Immigrants from Korea
67.4%
FAMILY HOUSEHOLDS
100.0/ 100
METRIC RATING
26th/ 347
METRIC RANK
66.0%
FAMILY HOUSEHOLDS
100.0/ 100
METRIC RATING
59th/ 347
METRIC RANK
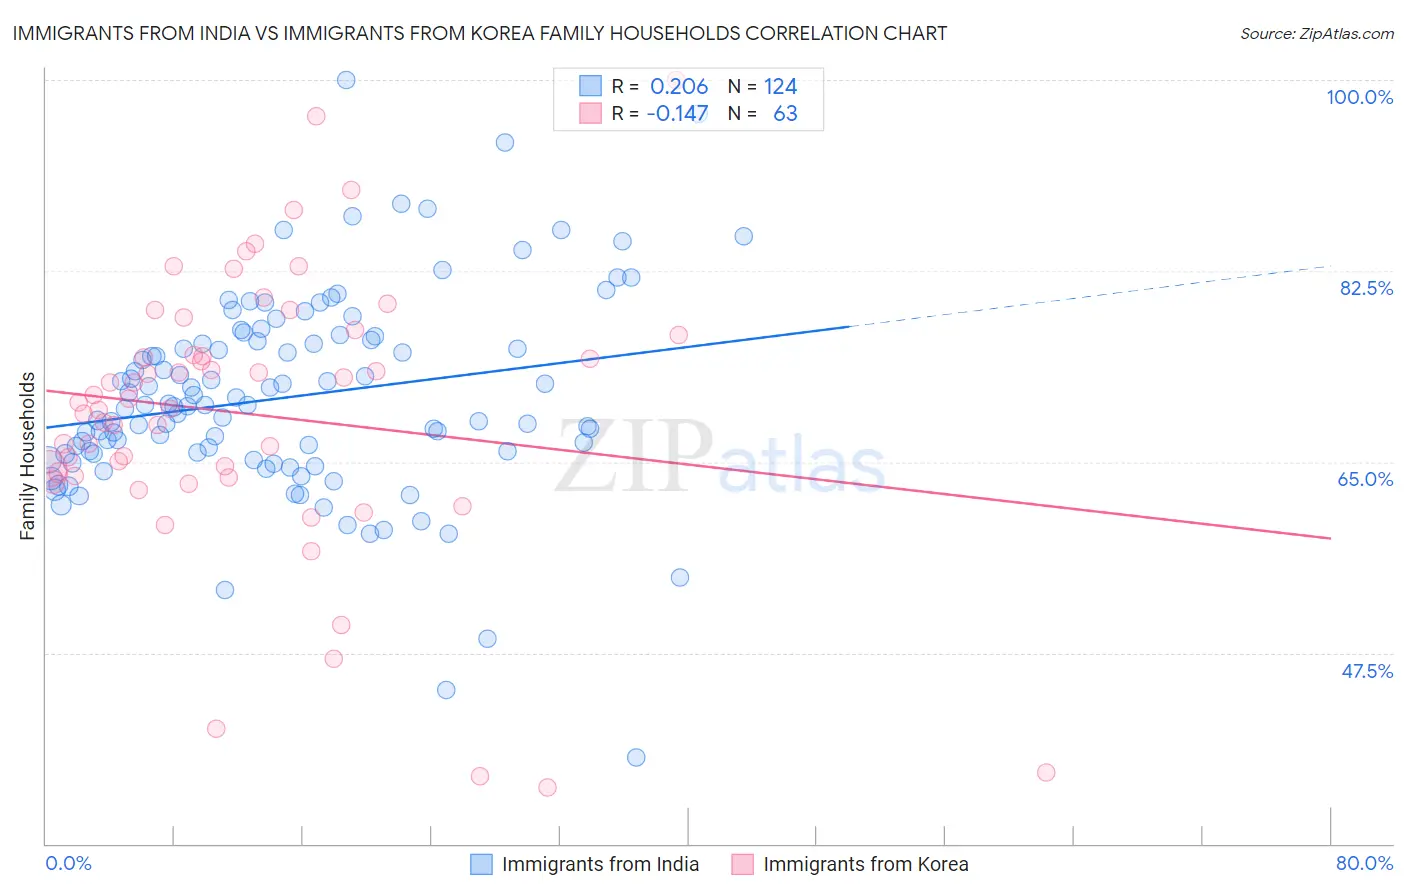
Immigrants from India vs Immigrants from Korea Family Households Correlation Chart
The statistical analysis conducted on geographies consisting of 433,768,337 people shows a weak positive correlation between the proportion of Immigrants from India and percentage of family households in the United States with a correlation coefficient (R) of 0.206 and weighted average of 67.4%. Similarly, the statistical analysis conducted on geographies consisting of 415,966,940 people shows a poor negative correlation between the proportion of Immigrants from Korea and percentage of family households in the United States with a correlation coefficient (R) of -0.147 and weighted average of 66.0%, a difference of 2.1%.
Family Households Correlation Summary
| Measurement | Immigrants from India | Immigrants from Korea |
| Minimum | 37.9% | 35.2% |
| Maximum | 100.0% | 100.0% |
| Range | 62.1% | 64.8% |
| Mean | 70.9% | 69.4% |
| Median | 70.2% | 70.4% |
| Interquartile 25% (IQ1) | 65.7% | 63.7% |
| Interquartile 75% (IQ3) | 76.1% | 76.6% |
| Interquartile Range (IQR) | 10.4% | 12.9% |
| Standard Deviation (Sample) | 9.4% | 12.8% |
| Standard Deviation (Population) | 9.4% | 12.7% |
Similar Demographics by Family Households
Demographics Similar to Immigrants from India by Family Households
In terms of family households, the demographic groups most similar to Immigrants from India are Immigrants from Nicaragua (67.5%, a difference of 0.010%), Immigrants from South Eastern Asia (67.5%, a difference of 0.040%), Hispanic or Latino (67.4%, a difference of 0.040%), Hawaiian (67.4%, a difference of 0.060%), and Nicaraguan (67.4%, a difference of 0.13%).
| Demographics | Rating | Rank | Family Households |
| Samoans | 100.0 /100 | #19 | Exceptional 67.9% |
| Inupiat | 100.0 /100 | #20 | Exceptional 67.8% |
| Cubans | 100.0 /100 | #21 | Exceptional 67.7% |
| Sri Lankans | 100.0 /100 | #22 | Exceptional 67.7% |
| Immigrants | Pakistan | 100.0 /100 | #23 | Exceptional 67.7% |
| Immigrants | South Eastern Asia | 100.0 /100 | #24 | Exceptional 67.5% |
| Immigrants | Nicaragua | 100.0 /100 | #25 | Exceptional 67.5% |
| Immigrants | India | 100.0 /100 | #26 | Exceptional 67.4% |
| Hispanics or Latinos | 100.0 /100 | #27 | Exceptional 67.4% |
| Hawaiians | 100.0 /100 | #28 | Exceptional 67.4% |
| Nicaraguans | 100.0 /100 | #29 | Exceptional 67.4% |
| Immigrants | Peru | 100.0 /100 | #30 | Exceptional 67.2% |
| Immigrants | Latin America | 100.0 /100 | #31 | Exceptional 67.2% |
| Nepalese | 100.0 /100 | #32 | Exceptional 67.2% |
| Salvadorans | 100.0 /100 | #33 | Exceptional 67.2% |
Demographics Similar to Immigrants from Korea by Family Households
In terms of family households, the demographic groups most similar to Immigrants from Korea are South American (66.0%, a difference of 0.010%), Immigrants from Asia (66.1%, a difference of 0.020%), Danish (66.0%, a difference of 0.030%), Central American (66.0%, a difference of 0.060%), and Immigrants from Indonesia (66.0%, a difference of 0.10%).
| Demographics | Rating | Rank | Family Households |
| Colombians | 100.0 /100 | #52 | Exceptional 66.3% |
| Afghans | 100.0 /100 | #53 | Exceptional 66.3% |
| Immigrants | Colombia | 100.0 /100 | #54 | Exceptional 66.3% |
| Immigrants | Immigrants | 100.0 /100 | #55 | Exceptional 66.1% |
| Immigrants | Hong Kong | 100.0 /100 | #56 | Exceptional 66.1% |
| Pennsylvania Germans | 100.0 /100 | #57 | Exceptional 66.1% |
| Immigrants | Asia | 100.0 /100 | #58 | Exceptional 66.1% |
| Immigrants | Korea | 100.0 /100 | #59 | Exceptional 66.0% |
| South Americans | 100.0 /100 | #60 | Exceptional 66.0% |
| Danes | 100.0 /100 | #61 | Exceptional 66.0% |
| Central Americans | 100.0 /100 | #62 | Exceptional 66.0% |
| Immigrants | Indonesia | 100.0 /100 | #63 | Exceptional 66.0% |
| Pima | 99.9 /100 | #64 | Exceptional 65.9% |
| Costa Ricans | 99.9 /100 | #65 | Exceptional 65.9% |
| Fijians | 99.9 /100 | #66 | Exceptional 65.9% |