Iraqi vs American Family Households with Children
COMPARE
Iraqi
American
Family Households with Children
Family Households with Children Comparison
Iraqis
Americans
28.5%
FAMILY HOUSEHOLDS WITH CHILDREN
99.9/ 100
METRIC RATING
73rd/ 347
METRIC RANK
27.3%
FAMILY HOUSEHOLDS WITH CHILDREN
22.8/ 100
METRIC RATING
202nd/ 347
METRIC RANK
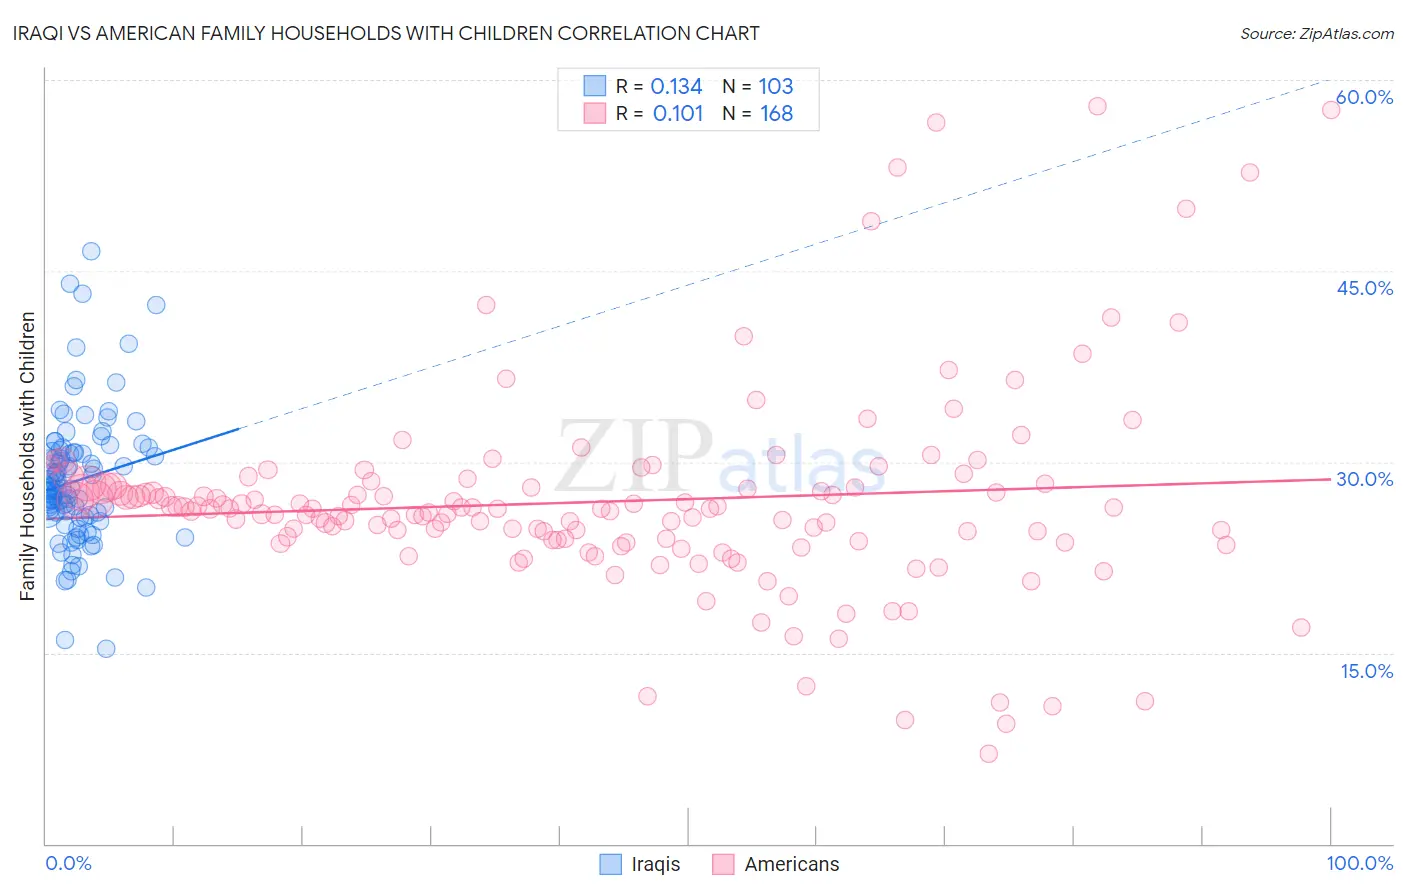
Iraqi vs American Family Households with Children Correlation Chart
The statistical analysis conducted on geographies consisting of 170,533,912 people shows a poor positive correlation between the proportion of Iraqis and percentage of family households with children in the United States with a correlation coefficient (R) of 0.134 and weighted average of 28.5%. Similarly, the statistical analysis conducted on geographies consisting of 580,876,887 people shows a poor positive correlation between the proportion of Americans and percentage of family households with children in the United States with a correlation coefficient (R) of 0.101 and weighted average of 27.3%, a difference of 4.5%.
Family Households with Children Correlation Summary
| Measurement | Iraqi | American |
| Minimum | 15.3% | 7.1% |
| Maximum | 46.5% | 57.9% |
| Range | 31.3% | 50.8% |
| Mean | 28.5% | 26.9% |
| Median | 27.9% | 26.3% |
| Interquartile 25% (IQ1) | 25.6% | 23.8% |
| Interquartile 75% (IQ3) | 30.8% | 28.0% |
| Interquartile Range (IQR) | 5.2% | 4.2% |
| Standard Deviation (Sample) | 5.2% | 7.9% |
| Standard Deviation (Population) | 5.2% | 7.9% |
Similar Demographics by Family Households with Children
Demographics Similar to Iraqis by Family Households with Children
In terms of family households with children, the demographic groups most similar to Iraqis are Laotian (28.5%, a difference of 0.010%), Immigrants from Indonesia (28.5%, a difference of 0.030%), Burmese (28.5%, a difference of 0.040%), Immigrants from Honduras (28.5%, a difference of 0.050%), and Immigrants from Korea (28.5%, a difference of 0.11%).
| Demographics | Rating | Rank | Family Households with Children |
| Immigrants | Egypt | 99.9 /100 | #66 | Exceptional 28.5% |
| Ghanaians | 99.9 /100 | #67 | Exceptional 28.5% |
| Houma | 99.9 /100 | #68 | Exceptional 28.5% |
| Immigrants | Korea | 99.9 /100 | #69 | Exceptional 28.5% |
| Immigrants | Honduras | 99.9 /100 | #70 | Exceptional 28.5% |
| Burmese | 99.9 /100 | #71 | Exceptional 28.5% |
| Immigrants | Indonesia | 99.9 /100 | #72 | Exceptional 28.5% |
| Iraqis | 99.9 /100 | #73 | Exceptional 28.5% |
| Laotians | 99.9 /100 | #74 | Exceptional 28.5% |
| Immigrants | Jordan | 99.9 /100 | #75 | Exceptional 28.4% |
| Immigrants | Sri Lanka | 99.9 /100 | #76 | Exceptional 28.4% |
| Nigerians | 99.8 /100 | #77 | Exceptional 28.4% |
| Immigrants | Nepal | 99.8 /100 | #78 | Exceptional 28.4% |
| Immigrants | Iraq | 99.8 /100 | #79 | Exceptional 28.4% |
| Natives/Alaskans | 99.8 /100 | #80 | Exceptional 28.4% |
Demographics Similar to Americans by Family Households with Children
In terms of family households with children, the demographic groups most similar to Americans are Kiowa (27.3%, a difference of 0.020%), Immigrants from Sudan (27.3%, a difference of 0.040%), Bhutanese (27.3%, a difference of 0.070%), Immigrants from Haiti (27.2%, a difference of 0.080%), and Immigrants from Micronesia (27.2%, a difference of 0.090%).
| Demographics | Rating | Rank | Family Households with Children |
| Crow | 35.7 /100 | #195 | Fair 27.4% |
| Cheyenne | 35.1 /100 | #196 | Fair 27.4% |
| Norwegians | 35.0 /100 | #197 | Fair 27.4% |
| Immigrants | Romania | 34.4 /100 | #198 | Fair 27.4% |
| English | 32.0 /100 | #199 | Fair 27.3% |
| Immigrants | Congo | 28.7 /100 | #200 | Fair 27.3% |
| Bhutanese | 25.1 /100 | #201 | Fair 27.3% |
| Americans | 22.8 /100 | #202 | Fair 27.3% |
| Kiowa | 22.2 /100 | #203 | Fair 27.3% |
| Immigrants | Sudan | 21.6 /100 | #204 | Fair 27.3% |
| Immigrants | Haiti | 20.3 /100 | #205 | Fair 27.2% |
| Immigrants | Micronesia | 20.2 /100 | #206 | Fair 27.2% |
| Haitians | 19.8 /100 | #207 | Poor 27.2% |
| Immigrants | Poland | 16.4 /100 | #208 | Poor 27.2% |
| Dutch West Indians | 15.8 /100 | #209 | Poor 27.2% |