Iraqi vs Immigrants from Liberia In Labor Force | Age 35-44
COMPARE
Iraqi
Immigrants from Liberia
In Labor Force | Age 35-44
In Labor Force | Age 35-44 Comparison
Iraqis
Immigrants from Liberia
83.8%
IN LABOR FORCE | AGE 35-44
1.3/ 100
METRIC RATING
241st/ 347
METRIC RANK
85.4%
IN LABOR FORCE | AGE 35-44
99.9/ 100
METRIC RATING
26th/ 347
METRIC RANK
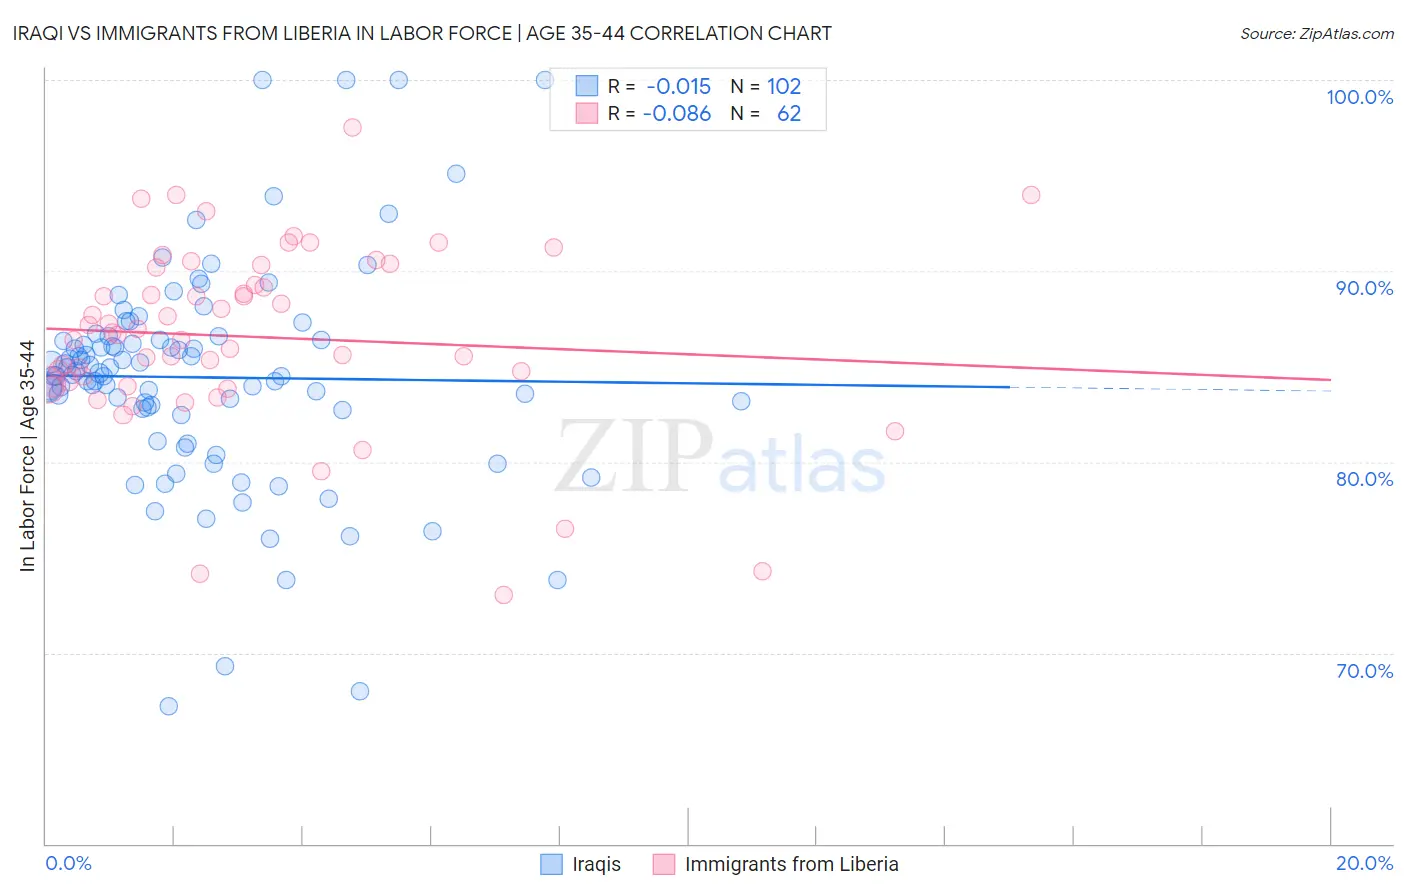
Iraqi vs Immigrants from Liberia In Labor Force | Age 35-44 Correlation Chart
The statistical analysis conducted on geographies consisting of 170,582,989 people shows no correlation between the proportion of Iraqis and labor force participation rate among population between the ages 35 and 44 in the United States with a correlation coefficient (R) of -0.015 and weighted average of 83.8%. Similarly, the statistical analysis conducted on geographies consisting of 135,260,455 people shows a slight negative correlation between the proportion of Immigrants from Liberia and labor force participation rate among population between the ages 35 and 44 in the United States with a correlation coefficient (R) of -0.086 and weighted average of 85.4%, a difference of 1.9%.
In Labor Force | Age 35-44 Correlation Summary
| Measurement | Iraqi | Immigrants from Liberia |
| Minimum | 67.2% | 73.0% |
| Maximum | 100.0% | 97.5% |
| Range | 32.8% | 24.5% |
| Mean | 84.4% | 86.5% |
| Median | 84.6% | 86.7% |
| Interquartile 25% (IQ1) | 82.7% | 84.0% |
| Interquartile 75% (IQ3) | 86.4% | 90.2% |
| Interquartile Range (IQR) | 3.7% | 6.2% |
| Standard Deviation (Sample) | 5.8% | 4.8% |
| Standard Deviation (Population) | 5.7% | 4.8% |
Similar Demographics by In Labor Force | Age 35-44
Demographics Similar to Iraqis by In Labor Force | Age 35-44
In terms of in labor force | age 35-44, the demographic groups most similar to Iraqis are Arab (83.8%, a difference of 0.0%), Celtic (83.8%, a difference of 0.010%), Immigrants from Cambodia (83.8%, a difference of 0.020%), Immigrants from Western Asia (83.8%, a difference of 0.030%), and Guyanese (83.8%, a difference of 0.030%).
| Demographics | Rating | Rank | In Labor Force | Age 35-44 |
| Immigrants | Oceania | 2.6 /100 | #234 | Tragic 83.9% |
| Immigrants | Syria | 2.5 /100 | #235 | Tragic 83.9% |
| West Indians | 2.4 /100 | #236 | Tragic 83.9% |
| English | 1.8 /100 | #237 | Tragic 83.8% |
| Immigrants | Laos | 1.7 /100 | #238 | Tragic 83.8% |
| Celtics | 1.4 /100 | #239 | Tragic 83.8% |
| Arabs | 1.3 /100 | #240 | Tragic 83.8% |
| Iraqis | 1.3 /100 | #241 | Tragic 83.8% |
| Immigrants | Cambodia | 1.1 /100 | #242 | Tragic 83.8% |
| Immigrants | Western Asia | 1.1 /100 | #243 | Tragic 83.8% |
| Guyanese | 1.1 /100 | #244 | Tragic 83.8% |
| Malaysians | 1.1 /100 | #245 | Tragic 83.8% |
| Immigrants | Immigrants | 1.0 /100 | #246 | Tragic 83.7% |
| Immigrants | Armenia | 0.9 /100 | #247 | Tragic 83.7% |
| Indonesians | 0.8 /100 | #248 | Tragic 83.7% |
Demographics Similar to Immigrants from Liberia by In Labor Force | Age 35-44
In terms of in labor force | age 35-44, the demographic groups most similar to Immigrants from Liberia are Paraguayan (85.4%, a difference of 0.0%), Immigrants from Lithuania (85.4%, a difference of 0.0%), Latvian (85.4%, a difference of 0.010%), Immigrants from Greece (85.3%, a difference of 0.020%), and Cambodian (85.3%, a difference of 0.050%).
| Demographics | Rating | Rank | In Labor Force | Age 35-44 |
| Slovenes | 100.0 /100 | #19 | Exceptional 85.6% |
| Immigrants | Serbia | 100.0 /100 | #20 | Exceptional 85.5% |
| Bulgarians | 100.0 /100 | #21 | Exceptional 85.5% |
| Immigrants | Bosnia and Herzegovina | 100.0 /100 | #22 | Exceptional 85.4% |
| Immigrants | Eastern Africa | 100.0 /100 | #23 | Exceptional 85.4% |
| Latvians | 99.9 /100 | #24 | Exceptional 85.4% |
| Paraguayans | 99.9 /100 | #25 | Exceptional 85.4% |
| Immigrants | Liberia | 99.9 /100 | #26 | Exceptional 85.4% |
| Immigrants | Lithuania | 99.9 /100 | #27 | Exceptional 85.4% |
| Immigrants | Greece | 99.9 /100 | #28 | Exceptional 85.3% |
| Cambodians | 99.9 /100 | #29 | Exceptional 85.3% |
| Bermudans | 99.9 /100 | #30 | Exceptional 85.3% |
| Czechs | 99.9 /100 | #31 | Exceptional 85.3% |
| Immigrants | India | 99.9 /100 | #32 | Exceptional 85.3% |
| Ugandans | 99.9 /100 | #33 | Exceptional 85.3% |