Iranian vs Nepalese Disability Age 65 to 74

COMPARE

Iranian
Race
Ancestry
AfghanAfricanAlaska NativeAlaskan AthabascanAlbanianAleutAlsatianAmericanApacheArabArapahoArgentineanArmenianAssyrian/Chaldean/SyriacAustralianAustrianBahamianBangladeshiBarbadianBasqueBelgianBelizeanBermudanBhutaneseBlackfeetBolivianBrazilianBritishBritish West IndianBulgarianBurmeseCajunCambodianCanadianCape VerdeanCarpatho RusynCelticCentral AmericanCentral American IndianCherokeeCheyenneChickasawChileanChineseChippewaChoctawColombianColvilleComancheCosta RicanCreeCreekCroatianCrowCubanCypriotCzechCzechoslovakianDanishDelawareDominicanDutchDutch West IndianEastern EuropeanEcuadorianEgyptianEnglishEstonianEthiopianEuropeanFijianFilipinoFinnishFrenchFrench American IndianFrench CanadianGermanGerman RussianGhanaianGreekGuamanian/ChamorroGuatemalanGuyaneseHaitianHmongHonduranHopiHoumaHungarianIcelanderIndian (Asian)IndonesianInupiatIranianIraqiIrishIroquoisIsraeliItalianJamaicanJapaneseJordanianKenyanKiowaKoreanLaotianLatvianLebaneseLiberianLithuanianLumbeeLuxembourgerMacedonianMalaysianMalteseMarshalleseMenomineeMexicanMexican American IndianMongolianMoroccanNative HawaiianNavajoNew ZealanderNicaraguanNigerianNorthern EuropeanNorwegianOkinawanOsageOttawaPaiutePakistaniPalestinianPanamanianParaguayanPennsylvania GermanPeruvianPimaPolishPortuguesePotawatomiPuebloPuerto RicanPuget Sound SalishRomanianRussianSalvadoranSamoanScandinavianScotch-IrishScottishSeminoleSenegaleseSerbianShoshoneSierra LeoneanSiouxSlavicSlovakSloveneSomaliSouth AfricanSouth AmericanSouth American IndianSoviet UnionSpaniardSpanishSpanish AmericanSpanish American IndianSri LankanSubsaharan AfricanSudaneseSwedishSwissSyrianTaiwaneseThaiTlingit-HaidaTohono O'OdhamTonganTrinidadian and TobagonianTsimshianTurkishU.S. Virgin IslanderUgandanUkrainianUruguayanUteVenezuelanVietnameseWelshWest IndianYakamaYaquiYugoslavianYumanYup'ikZimbabwean
Immigration
NonimmigrantsImmigrantsAfghanistanAfricaAlbaniaArgentinaArmeniaAsiaAustraliaAustriaBahamasBangladeshBarbadosBelarusBelgiumBelizeBoliviaBosnia and HerzegovinaBrazilBulgariaBurma/MyanmarCabo VerdeCambodiaCameroonCanadaCaribbeanCentral AmericaChileChinaColombiaCongoCosta RicaCroatiaCubaCzechoslovakiaDenmarkDominicaDominican RepublicEastern AfricaEastern AsiaEastern EuropeEcuadorEgyptEl SalvadorEnglandEritreaEthiopiaEuropeFijiFranceGermanyGhanaGreeceGrenadaGuatemalaGuyanaHaitiHondurasHong KongHungaryIndiaIndonesiaIranIraqIrelandIsraelItalyJamaicaJapanJordanKazakhstanKenyaKoreaKuwaitLaosLatin AmericaLatviaLebanonLiberiaLithuaniaMalaysiaMexicoMicronesiaMiddle AfricaMoldovaMoroccoNepalNetherlandsNicaraguaNigeriaNorth AmericaNorth MacedoniaNorthern AfricaNorthern EuropeNorwayOceaniaPakistanPanamaPeruPhilippinesPolandPortugalRomaniaRussiaSaudi ArabiaScotlandSenegalSerbiaSierra LeoneSingaporeSomaliaSouth AfricaSouth AmericaSouth Central AsiaSouth Eastern AsiaSouthern EuropeSpainSri LankaSt. Vincent and the GrenadinesSudanSwedenSwitzerlandSyriaTaiwanThailandTrinidad and TobagoTurkeyUgandaUkraineUruguayUzbekistanVenezuelaVietnamWest IndiesWestern AfricaWestern AsiaWestern EuropeYemenZaireZimbabweAzores
Nepalese
Race
Ancestry
AfghanAfricanAlaska NativeAlaskan AthabascanAlbanianAleutAlsatianAmericanApacheArabArapahoArgentineanArmenianAssyrian/Chaldean/SyriacAustralianAustrianBahamianBangladeshiBarbadianBasqueBelgianBelizeanBermudanBhutaneseBlackfeetBolivianBrazilianBritishBritish West IndianBulgarianBurmeseCajunCambodianCanadianCape VerdeanCarpatho RusynCelticCentral AmericanCentral American IndianCherokeeCheyenneChickasawChileanChineseChippewaChoctawColombianColvilleComancheCosta RicanCreeCreekCroatianCrowCubanCypriotCzechCzechoslovakianDanishDelawareDominicanDutchDutch West IndianEastern EuropeanEcuadorianEgyptianEnglishEstonianEthiopianEuropeanFijianFilipinoFinnishFrenchFrench American IndianFrench CanadianGermanGerman RussianGhanaianGreekGuamanian/ChamorroGuatemalanGuyaneseHaitianHmongHonduranHopiHoumaHungarianIcelanderIndian (Asian)IndonesianInupiatIraqiIrishIroquoisIsraeliItalianJamaicanJapaneseJordanianKenyanKiowaKoreanLaotianLatvianLebaneseLiberianLithuanianLumbeeLuxembourgerMacedonianMalaysianMalteseMarshalleseMenomineeMexicanMexican American IndianMongolianMoroccanNative HawaiianNavajoNepaleseNew ZealanderNicaraguanNigerianNorthern EuropeanNorwegianOkinawanOsageOttawaPaiutePakistaniPalestinianPanamanianParaguayanPennsylvania GermanPeruvianPimaPolishPortuguesePotawatomiPuebloPuerto RicanPuget Sound SalishRomanianRussianSalvadoranSamoanScandinavianScotch-IrishScottishSeminoleSenegaleseSerbianShoshoneSierra LeoneanSiouxSlavicSlovakSloveneSomaliSouth AfricanSouth AmericanSouth American IndianSoviet UnionSpaniardSpanishSpanish AmericanSpanish American IndianSri LankanSubsaharan AfricanSudaneseSwedishSwissSyrianTaiwaneseThaiTlingit-HaidaTohono O'OdhamTonganTrinidadian and TobagonianTsimshianTurkishU.S. Virgin IslanderUgandanUkrainianUruguayanUteVenezuelanVietnameseWelshWest IndianYakamaYaquiYugoslavianYumanYup'ikZimbabwean
Immigration
NonimmigrantsImmigrantsAfghanistanAfricaAlbaniaArgentinaArmeniaAsiaAustraliaAustriaBahamasBangladeshBarbadosBelarusBelgiumBelizeBoliviaBosnia and HerzegovinaBrazilBulgariaBurma/MyanmarCabo VerdeCambodiaCameroonCanadaCaribbeanCentral AmericaChileChinaColombiaCongoCosta RicaCroatiaCubaCzechoslovakiaDenmarkDominicaDominican RepublicEastern AfricaEastern AsiaEastern EuropeEcuadorEgyptEl SalvadorEnglandEritreaEthiopiaEuropeFijiFranceGermanyGhanaGreeceGrenadaGuatemalaGuyanaHaitiHondurasHong KongHungaryIndiaIndonesiaIranIraqIrelandIsraelItalyJamaicaJapanJordanKazakhstanKenyaKoreaKuwaitLaosLatin AmericaLatviaLebanonLiberiaLithuaniaMalaysiaMexicoMicronesiaMiddle AfricaMoldovaMoroccoNepalNetherlandsNicaraguaNigeriaNorth AmericaNorth MacedoniaNorthern AfricaNorthern EuropeNorwayOceaniaPakistanPanamaPeruPhilippinesPolandPortugalRomaniaRussiaSaudi ArabiaScotlandSenegalSerbiaSierra LeoneSingaporeSomaliaSouth AfricaSouth AmericaSouth Central AsiaSouth Eastern AsiaSouthern EuropeSpainSri LankaSt. Vincent and the GrenadinesSudanSwedenSwitzerlandSyriaTaiwanThailandTrinidad and TobagoTurkeyUgandaUkraineUruguayUzbekistanVenezuelaVietnamWest IndiesWestern AfricaWestern AsiaWestern EuropeYemenZaireZimbabweAzores
Disability Age 65 to 74
Income
Poverty
Unemployment
Labor Participation
Family Structure
Vehicle Availability
Education Level
Disability

Disability Age 65 to 74 Comparison

Iranians

Nepalese

Exceptional
Tragic
19.9%
DISABILITY AGE 65 TO 74
100.0/ 100
METRIC RATING
6th/ 347
METRIC RANK
28.0%
DISABILITY AGE 65 TO 74
0.0/ 100
METRIC RATING
318th/ 347
METRIC RANK

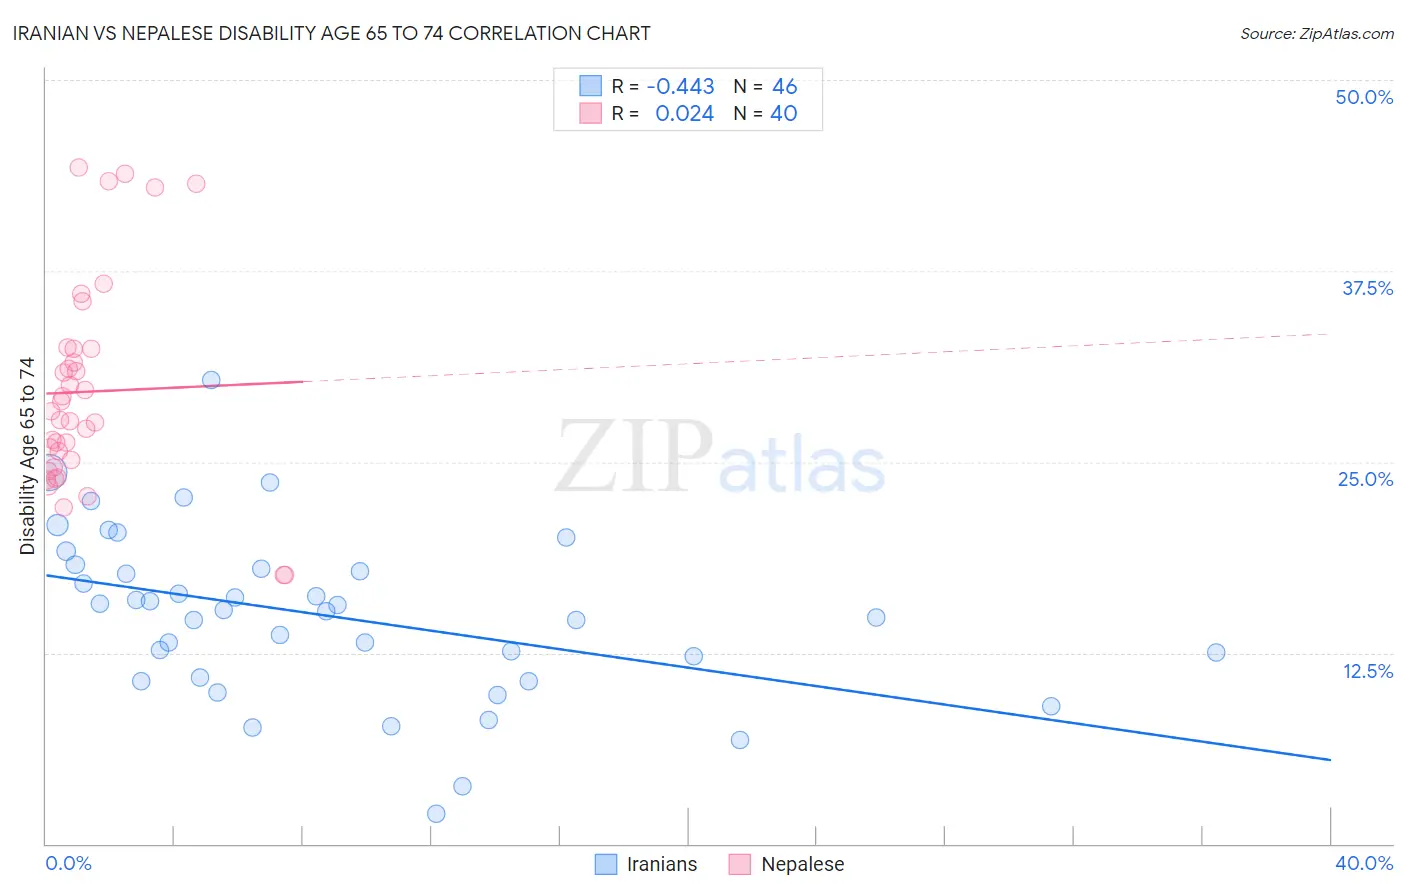
Iranian vs Nepalese Disability Age 65 to 74 Correlation Chart

The statistical analysis conducted on geographies consisting of 316,255,401 people shows a moderate negative correlation between the proportion of Iranians and percentage of population with a disability between the ages 65 and 75 in the United States with a correlation coefficient (R) of -0.443 and weighted average of 19.9%. Similarly, the statistical analysis conducted on geographies consisting of 24,503,622 people shows no correlation between the proportion of Nepalese and percentage of population with a disability between the ages 65 and 75 in the United States with a correlation coefficient (R) of 0.024 and weighted average of 28.0%, a difference of 40.6%.
Iranian vs Nepalese Disability Age 65 to 74

Disability Age 65 to 74 Correlation Summary

MeasurementIranianNepalese
Minimum2.0%17.6%
Maximum30.4%44.3%
Range28.4%26.7%
Mean14.9%29.6%
Median15.3%28.1%
Interquartile 25% (IQ1)10.9%24.9%
Interquartile 75% (IQ3)18.0%32.4%
Interquartile Range (IQR)7.1%7.5%
Standard Deviation (Sample)5.6%6.8%
Standard Deviation (Population)5.5%6.7%

Similar Demographics by Disability Age 65 to 74

Demographics Similar to Iranians by Disability Age 65 to 74

In terms of disability age 65 to 74, the demographic groups most similar to Iranians are Immigrants from Israel (19.9%, a difference of 0.11%), Immigrants from Hong Kong (19.9%, a difference of 0.41%), Cypriot (20.1%, a difference of 0.67%), Thai (20.1%, a difference of 0.70%), and Immigrants from India (19.7%, a difference of 1.3%).
DemographicsRating | RankDisability Age 65 to 74
Immigrants | Taiwan
100.0
/100
|
#1
Exceptional
18.8%
Filipinos
100.0
/100
|
#2
Exceptional
19.0%
Immigrants | India
100.0
/100
|
#3
Exceptional
19.7%
Immigrants | Hong Kong
100.0
/100
|
#4
Exceptional
19.9%
Immigrants | Israel
100.0
/100
|
#5
Exceptional
19.9%
Iranians
100.0
/100
|
#6
Exceptional
19.9%
Cypriots
100.0
/100
|
#7
Exceptional
20.1%
Thais
100.0
/100
|
#8
Exceptional
20.1%
Immigrants | China
100.0
/100
|
#9
Exceptional
20.3%
Immigrants | Eastern Asia
100.0
/100
|
#10
Exceptional
20.3%
Immigrants | Ireland
100.0
/100
|
#11
Exceptional
20.3%
Immigrants | Korea
100.0
/100
|
#12
Exceptional
20.4%
Immigrants | Singapore
100.0
/100
|
#13
Exceptional
20.4%
Indians (Asian)
100.0
/100
|
#14
Exceptional
20.5%
Paraguayans
100.0
/100
|
#15
Exceptional
20.5%

Demographics Similar to Nepalese by Disability Age 65 to 74

In terms of disability age 65 to 74, the demographic groups most similar to Nepalese are Immigrants from Armenia (28.0%, a difference of 0.22%), Arapaho (28.1%, a difference of 0.23%), Crow (27.9%, a difference of 0.31%), Cajun (27.9%, a difference of 0.35%), and Cherokee (28.2%, a difference of 0.62%).
DemographicsRating | RankDisability Age 65 to 74
Menominee
0.0
/100
|
#311
Tragic
27.4%
Osage
0.0
/100
|
#312
Tragic
27.5%
Paiute
0.0
/100
|
#313
Tragic
27.8%
Chippewa
0.0
/100
|
#314
Tragic
27.8%
Cajuns
0.0
/100
|
#315
Tragic
27.9%
Crow
0.0
/100
|
#316
Tragic
27.9%
Immigrants | Armenia
0.0
/100
|
#317
Tragic
28.0%
Nepalese
0.0
/100
|
#318
Tragic
28.0%
Arapaho
0.0
/100
|
#319
Tragic
28.1%
Cherokee
0.0
/100
|
#320
Tragic
28.2%
Comanche
0.0
/100
|
#321
Tragic
28.3%
Aleuts
0.0
/100
|
#322
Tragic
28.4%
Puerto Ricans
0.0
/100
|
#323
Tragic
29.1%
Seminole
0.0
/100
|
#324
Tragic
29.4%
Dutch West Indians
0.0
/100
|
#325
Tragic
29.6%