Immigrants from Uganda vs Jamaican Single Father Households
COMPARE
Immigrants from Uganda
Jamaican
Single Father Households
Single Father Households Comparison
Immigrants from Uganda
Jamaicans
2.4%
SINGLE FATHER HOUSEHOLDS
26.0/ 100
METRIC RATING
201st/ 347
METRIC RANK
2.3%
SINGLE FATHER HOUSEHOLDS
43.5/ 100
METRIC RATING
181st/ 347
METRIC RANK
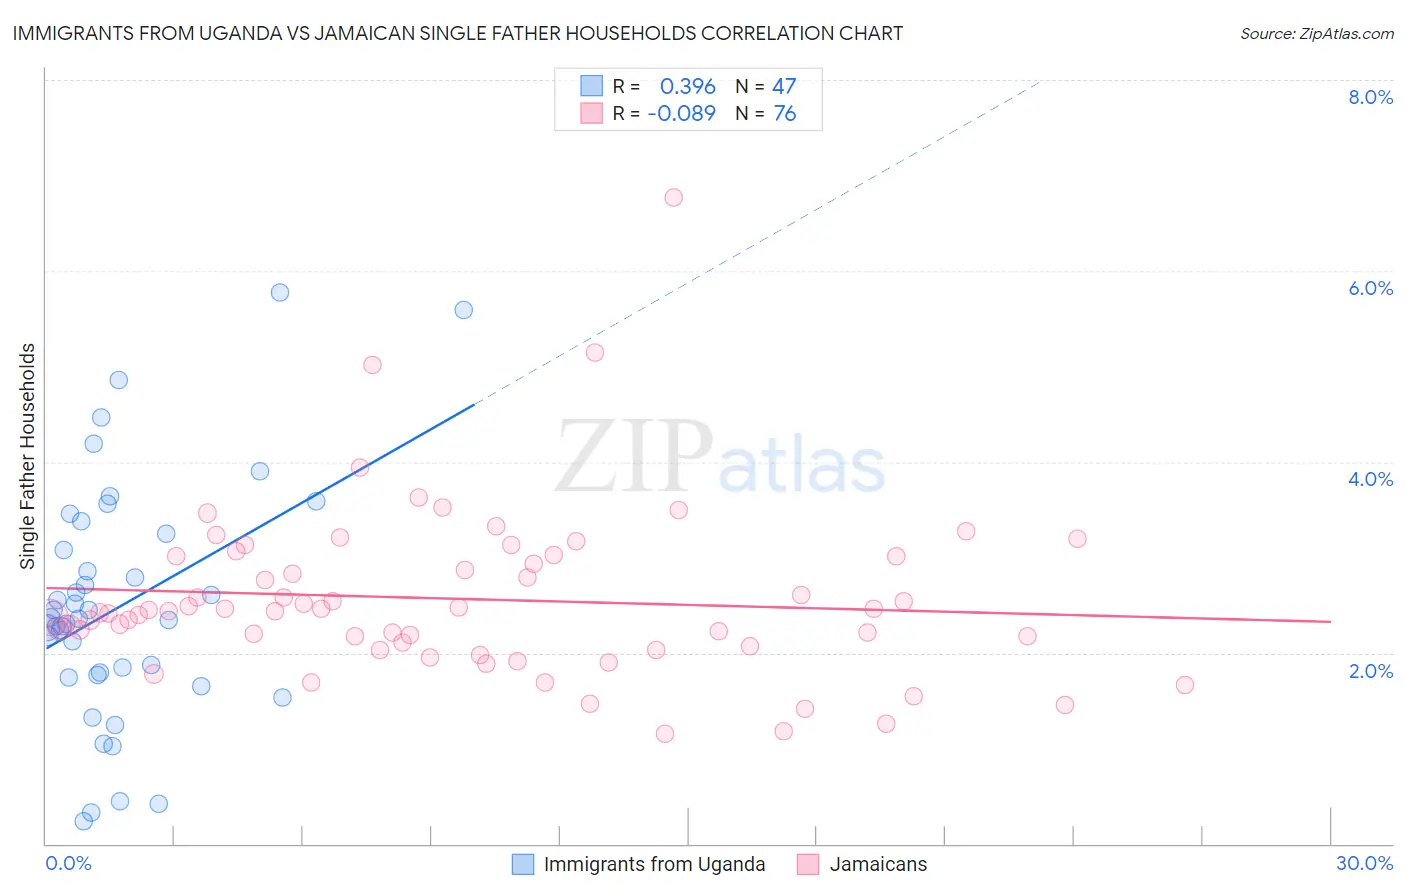
Immigrants from Uganda vs Jamaican Single Father Households Correlation Chart
The statistical analysis conducted on geographies consisting of 125,685,639 people shows a mild positive correlation between the proportion of Immigrants from Uganda and percentage of single father households in the United States with a correlation coefficient (R) of 0.396 and weighted average of 2.4%. Similarly, the statistical analysis conducted on geographies consisting of 365,117,858 people shows a slight negative correlation between the proportion of Jamaicans and percentage of single father households in the United States with a correlation coefficient (R) of -0.089 and weighted average of 2.3%, a difference of 1.4%.
Single Father Households Correlation Summary
| Measurement | Immigrants from Uganda | Jamaican |
| Minimum | 0.24% | 1.2% |
| Maximum | 5.8% | 6.8% |
| Range | 5.5% | 5.6% |
| Mean | 2.5% | 2.6% |
| Median | 2.4% | 2.4% |
| Interquartile 25% (IQ1) | 1.8% | 2.1% |
| Interquartile 75% (IQ3) | 3.2% | 3.0% |
| Interquartile Range (IQR) | 1.5% | 0.92% |
| Standard Deviation (Sample) | 1.2% | 0.88% |
| Standard Deviation (Population) | 1.2% | 0.88% |
Demographics Similar to Immigrants from Uganda and Jamaicans by Single Father Households
In terms of single father households, the demographic groups most similar to Immigrants from Uganda are Immigrants from Vietnam (2.4%, a difference of 0.10%), Peruvian (2.4%, a difference of 0.10%), Scandinavian (2.4%, a difference of 0.13%), German (2.4%, a difference of 0.18%), and Kenyan (2.4%, a difference of 0.19%). Similarly, the demographic groups most similar to Jamaicans are Belgian (2.3%, a difference of 0.020%), Immigrants from Panama (2.4%, a difference of 0.12%), Sri Lankan (2.4%, a difference of 0.13%), Nigerian (2.4%, a difference of 0.18%), and Immigrants from Bosnia and Herzegovina (2.4%, a difference of 0.23%).
| Demographics | Rating | Rank | Single Father Households |
| Jamaicans | 43.5 /100 | #181 | Average 2.3% |
| Belgians | 43.3 /100 | #182 | Average 2.3% |
| Immigrants | Panama | 41.8 /100 | #183 | Average 2.4% |
| Sri Lankans | 41.8 /100 | #184 | Average 2.4% |
| Nigerians | 41.0 /100 | #185 | Average 2.4% |
| Immigrants | Bosnia and Herzegovina | 40.4 /100 | #186 | Average 2.4% |
| Immigrants | Colombia | 34.0 /100 | #187 | Fair 2.4% |
| Hmong | 33.0 /100 | #188 | Fair 2.4% |
| U.S. Virgin Islanders | 31.8 /100 | #189 | Fair 2.4% |
| French | 31.7 /100 | #190 | Fair 2.4% |
| Immigrants | Africa | 30.0 /100 | #191 | Fair 2.4% |
| Immigrants | Sudan | 29.8 /100 | #192 | Fair 2.4% |
| Uruguayans | 29.7 /100 | #193 | Fair 2.4% |
| Panamanians | 29.6 /100 | #194 | Fair 2.4% |
| Immigrants | Philippines | 28.7 /100 | #195 | Fair 2.4% |
| Kenyans | 28.0 /100 | #196 | Fair 2.4% |
| Germans | 28.0 /100 | #197 | Fair 2.4% |
| Scandinavians | 27.4 /100 | #198 | Fair 2.4% |
| Immigrants | Vietnam | 27.1 /100 | #199 | Fair 2.4% |
| Peruvians | 27.1 /100 | #200 | Fair 2.4% |
| Immigrants | Uganda | 26.0 /100 | #201 | Fair 2.4% |