Iranian vs Icelander Single Mother Households
COMPARE
Iranian
Icelander
Single Mother Households
Single Mother Households Comparison
Iranians
Icelanders
5.0%
SINGLE MOTHER HOUSEHOLDS
100.0/ 100
METRIC RATING
7th/ 347
METRIC RANK
6.0%
SINGLE MOTHER HOUSEHOLDS
86.9/ 100
METRIC RATING
138th/ 347
METRIC RANK
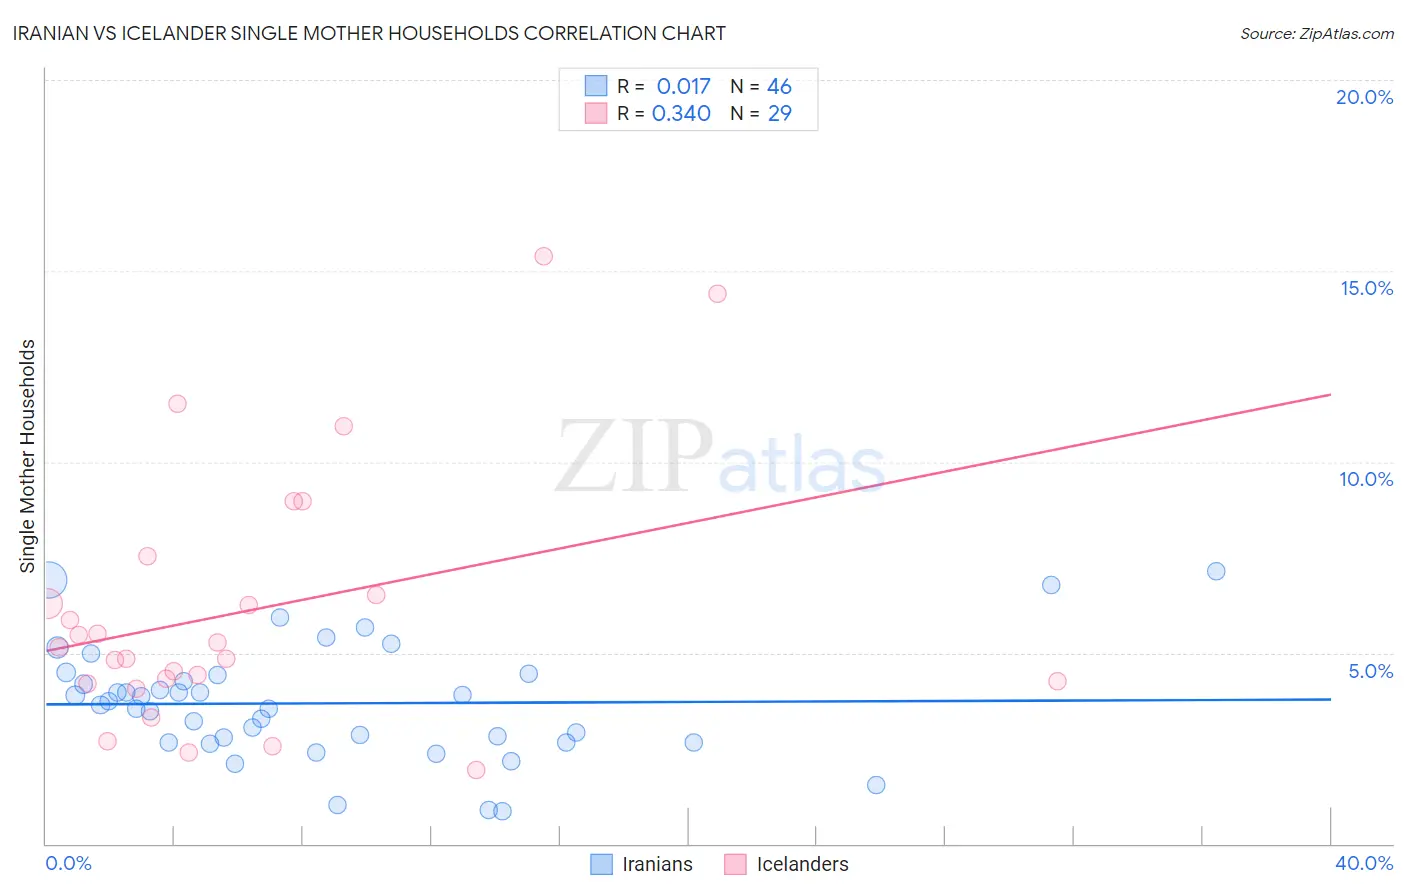
Iranian vs Icelander Single Mother Households Correlation Chart
The statistical analysis conducted on geographies consisting of 316,158,075 people shows no correlation between the proportion of Iranians and percentage of single mother households in the United States with a correlation coefficient (R) of 0.017 and weighted average of 5.0%. Similarly, the statistical analysis conducted on geographies consisting of 159,379,792 people shows a mild positive correlation between the proportion of Icelanders and percentage of single mother households in the United States with a correlation coefficient (R) of 0.340 and weighted average of 6.0%, a difference of 20.4%.
Single Mother Households Correlation Summary
| Measurement | Iranian | Icelander |
| Minimum | 0.85% | 1.9% |
| Maximum | 7.1% | 15.4% |
| Range | 6.3% | 13.5% |
| Mean | 3.7% | 6.1% |
| Median | 3.7% | 5.1% |
| Interquartile 25% (IQ1) | 2.7% | 4.2% |
| Interquartile 75% (IQ3) | 4.4% | 7.0% |
| Interquartile Range (IQR) | 1.8% | 2.8% |
| Standard Deviation (Sample) | 1.5% | 3.4% |
| Standard Deviation (Population) | 1.5% | 3.3% |
Similar Demographics by Single Mother Households
Demographics Similar to Iranians by Single Mother Households
In terms of single mother households, the demographic groups most similar to Iranians are Immigrants from Singapore (5.0%, a difference of 0.25%), Immigrants from Ireland (5.0%, a difference of 0.66%), Okinawan (5.0%, a difference of 0.81%), Immigrants from Israel (5.0%, a difference of 1.1%), and Immigrants from China (5.1%, a difference of 1.8%).
| Demographics | Rating | Rank | Single Mother Households |
| Immigrants | Taiwan | 100.0 /100 | #1 | Exceptional 4.7% |
| Filipinos | 100.0 /100 | #2 | Exceptional 4.7% |
| Immigrants | Iran | 100.0 /100 | #3 | Exceptional 4.8% |
| Assyrians/Chaldeans/Syriacs | 100.0 /100 | #4 | Exceptional 4.8% |
| Immigrants | Hong Kong | 100.0 /100 | #5 | Exceptional 4.8% |
| Immigrants | Singapore | 100.0 /100 | #6 | Exceptional 5.0% |
| Iranians | 100.0 /100 | #7 | Exceptional 5.0% |
| Immigrants | Ireland | 99.9 /100 | #8 | Exceptional 5.0% |
| Okinawans | 99.9 /100 | #9 | Exceptional 5.0% |
| Immigrants | Israel | 99.9 /100 | #10 | Exceptional 5.0% |
| Immigrants | China | 99.9 /100 | #11 | Exceptional 5.1% |
| Cypriots | 99.9 /100 | #12 | Exceptional 5.1% |
| Immigrants | India | 99.9 /100 | #13 | Exceptional 5.1% |
| Immigrants | Australia | 99.9 /100 | #14 | Exceptional 5.1% |
| Immigrants | Eastern Asia | 99.9 /100 | #15 | Exceptional 5.1% |
Demographics Similar to Icelanders by Single Mother Households
In terms of single mother households, the demographic groups most similar to Icelanders are Syrian (6.0%, a difference of 0.23%), French (6.0%, a difference of 0.30%), Tsimshian (6.0%, a difference of 0.40%), Immigrants from Pakistan (6.0%, a difference of 0.41%), and Immigrants from Egypt (6.0%, a difference of 0.45%).
| Demographics | Rating | Rank | Single Mother Households |
| Immigrants | Spain | 91.2 /100 | #131 | Exceptional 5.9% |
| Albanians | 91.1 /100 | #132 | Exceptional 5.9% |
| Egyptians | 90.7 /100 | #133 | Exceptional 5.9% |
| Canadians | 90.5 /100 | #134 | Exceptional 5.9% |
| Immigrants | Saudi Arabia | 90.2 /100 | #135 | Exceptional 5.9% |
| Jordanians | 88.9 /100 | #136 | Excellent 6.0% |
| Immigrants | Pakistan | 88.4 /100 | #137 | Excellent 6.0% |
| Icelanders | 86.9 /100 | #138 | Excellent 6.0% |
| Syrians | 86.0 /100 | #139 | Excellent 6.0% |
| French | 85.7 /100 | #140 | Excellent 6.0% |
| Tsimshian | 85.2 /100 | #141 | Excellent 6.0% |
| Immigrants | Egypt | 85.0 /100 | #142 | Excellent 6.0% |
| Immigrants | Iraq | 84.8 /100 | #143 | Excellent 6.0% |
| Koreans | 84.4 /100 | #144 | Excellent 6.0% |
| Arabs | 84.0 /100 | #145 | Excellent 6.0% |