Immigrants from Peru vs Serbian Currently Married
COMPARE
Immigrants from Peru
Serbian
Currently Married
Currently Married Comparison
Immigrants from Peru
Serbians
46.4%
CURRENTLY MARRIED
35.3/ 100
METRIC RATING
187th/ 347
METRIC RANK
47.8%
CURRENTLY MARRIED
93.6/ 100
METRIC RATING
104th/ 347
METRIC RANK
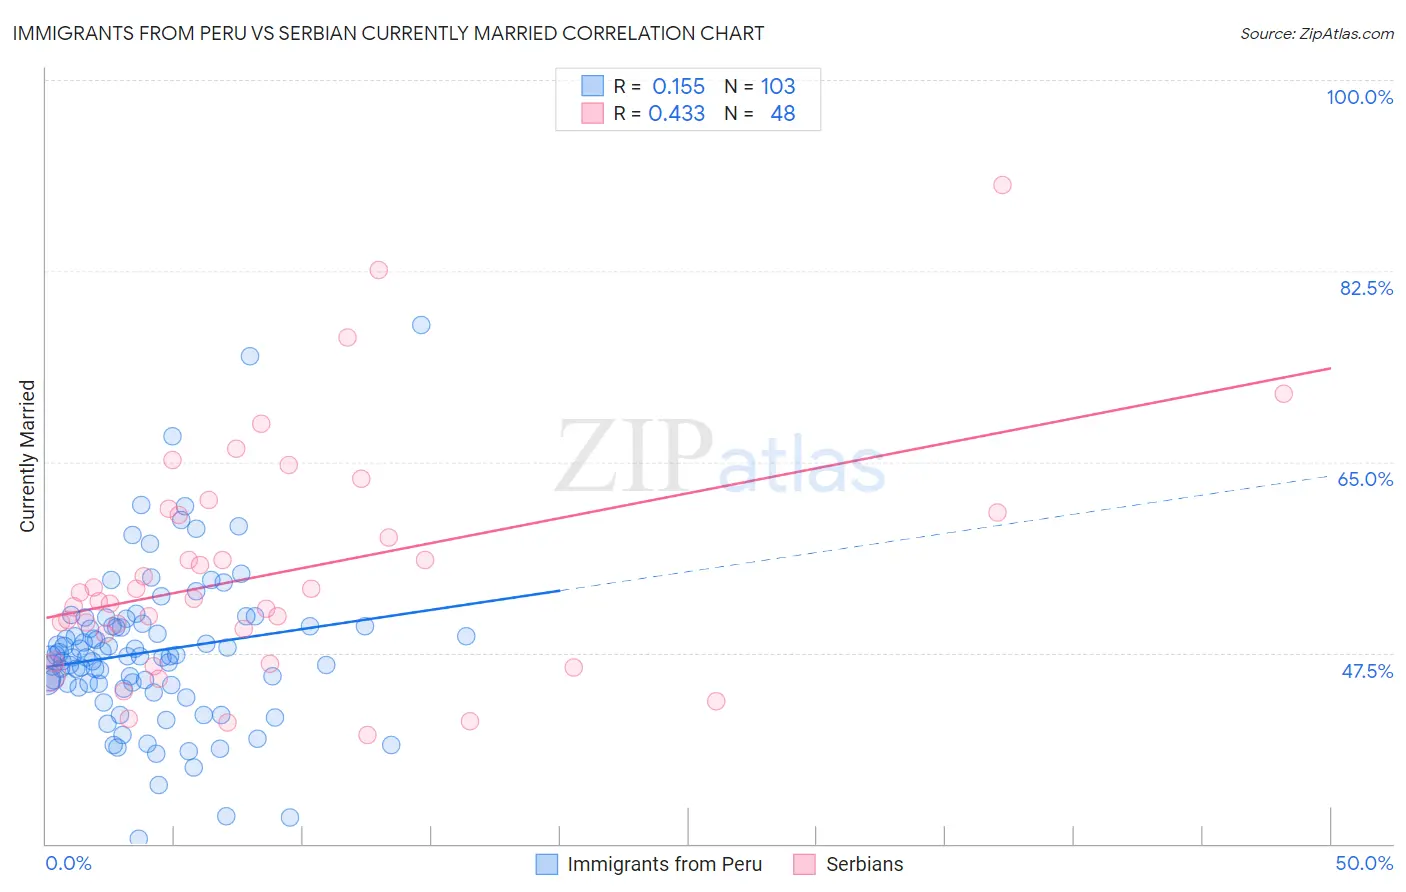
Immigrants from Peru vs Serbian Currently Married Correlation Chart
The statistical analysis conducted on geographies consisting of 328,847,084 people shows a poor positive correlation between the proportion of Immigrants from Peru and percentage of population currently married in the United States with a correlation coefficient (R) of 0.155 and weighted average of 46.4%. Similarly, the statistical analysis conducted on geographies consisting of 267,625,038 people shows a moderate positive correlation between the proportion of Serbians and percentage of population currently married in the United States with a correlation coefficient (R) of 0.433 and weighted average of 47.8%, a difference of 3.0%.
Currently Married Correlation Summary
| Measurement | Immigrants from Peru | Serbian |
| Minimum | 30.4% | 40.0% |
| Maximum | 77.5% | 90.4% |
| Range | 47.1% | 50.4% |
| Mean | 47.6% | 54.8% |
| Median | 47.2% | 52.3% |
| Interquartile 25% (IQ1) | 44.5% | 47.9% |
| Interquartile 75% (IQ3) | 49.9% | 60.3% |
| Interquartile Range (IQR) | 5.4% | 12.3% |
| Standard Deviation (Sample) | 7.3% | 10.6% |
| Standard Deviation (Population) | 7.3% | 10.4% |
Similar Demographics by Currently Married
Demographics Similar to Immigrants from Peru by Currently Married
In terms of currently married, the demographic groups most similar to Immigrants from Peru are Immigrants from Chile (46.4%, a difference of 0.060%), Mongolian (46.4%, a difference of 0.090%), Colombian (46.3%, a difference of 0.14%), Brazilian (46.4%, a difference of 0.16%), and Immigrants from Northern Africa (46.5%, a difference of 0.17%).
| Demographics | Rating | Rank | Currently Married |
| Costa Ricans | 43.7 /100 | #180 | Average 46.5% |
| Ottawa | 43.0 /100 | #181 | Average 46.5% |
| Potawatomi | 41.9 /100 | #182 | Average 46.5% |
| Immigrants | Northern Africa | 39.7 /100 | #183 | Fair 46.5% |
| Brazilians | 39.3 /100 | #184 | Fair 46.4% |
| Mongolians | 37.6 /100 | #185 | Fair 46.4% |
| Immigrants | Chile | 36.8 /100 | #186 | Fair 46.4% |
| Immigrants | Peru | 35.3 /100 | #187 | Fair 46.4% |
| Colombians | 31.8 /100 | #188 | Fair 46.3% |
| Fijians | 30.3 /100 | #189 | Fair 46.3% |
| Choctaw | 29.1 /100 | #190 | Fair 46.3% |
| Immigrants | France | 27.7 /100 | #191 | Fair 46.2% |
| Soviet Union | 25.7 /100 | #192 | Fair 46.2% |
| Immigrants | Fiji | 25.0 /100 | #193 | Fair 46.2% |
| South Americans | 23.8 /100 | #194 | Fair 46.1% |
Demographics Similar to Serbians by Currently Married
In terms of currently married, the demographic groups most similar to Serbians are Cypriot (47.8%, a difference of 0.020%), Turkish (47.8%, a difference of 0.050%), Immigrants from Singapore (47.8%, a difference of 0.050%), Immigrants from Germany (47.8%, a difference of 0.070%), and Celtic (47.8%, a difference of 0.080%).
| Demographics | Rating | Rank | Currently Married |
| Immigrants | Ukraine | 94.8 /100 | #97 | Exceptional 47.9% |
| Immigrants | China | 94.7 /100 | #98 | Exceptional 47.9% |
| Immigrants | Sweden | 94.3 /100 | #99 | Exceptional 47.8% |
| Celtics | 94.2 /100 | #100 | Exceptional 47.8% |
| Immigrants | Germany | 94.1 /100 | #101 | Exceptional 47.8% |
| Turks | 93.9 /100 | #102 | Exceptional 47.8% |
| Cypriots | 93.7 /100 | #103 | Exceptional 47.8% |
| Serbians | 93.6 /100 | #104 | Exceptional 47.8% |
| Immigrants | Singapore | 93.3 /100 | #105 | Exceptional 47.8% |
| Immigrants | Greece | 93.1 /100 | #106 | Exceptional 47.7% |
| Immigrants | Italy | 92.9 /100 | #107 | Exceptional 47.7% |
| Tsimshian | 92.4 /100 | #108 | Exceptional 47.7% |
| Immigrants | Egypt | 92.3 /100 | #109 | Exceptional 47.7% |
| Immigrants | Russia | 92.0 /100 | #110 | Exceptional 47.7% |
| Immigrants | Hungary | 91.2 /100 | #111 | Exceptional 47.6% |