Indonesian vs Cajun No Vehicles in Household
COMPARE
Indonesian
Cajun
No Vehicles in Household
No Vehicles in Household Comparison
Indonesians
Cajuns
10.3%
NO VEHICLES IN HOUSEHOLD
56.7/ 100
METRIC RATING
168th/ 347
METRIC RANK
8.4%
NO VEHICLES IN HOUSEHOLD
99.6/ 100
METRIC RATING
70th/ 347
METRIC RANK
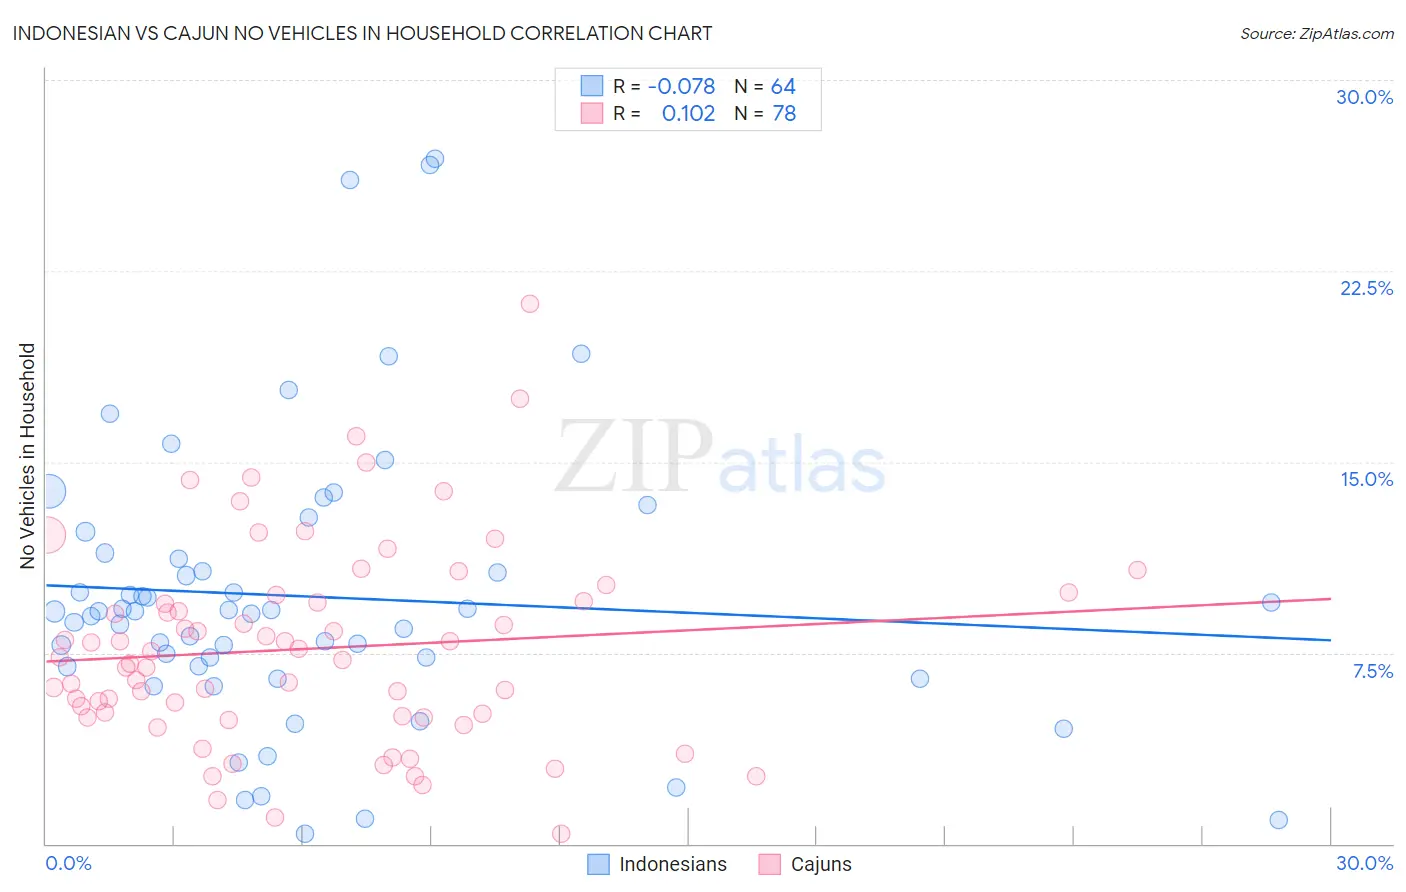
Indonesian vs Cajun No Vehicles in Household Correlation Chart
The statistical analysis conducted on geographies consisting of 162,572,047 people shows a slight negative correlation between the proportion of Indonesians and percentage of households with no vehicle available in the United States with a correlation coefficient (R) of -0.078 and weighted average of 10.3%. Similarly, the statistical analysis conducted on geographies consisting of 149,490,640 people shows a poor positive correlation between the proportion of Cajuns and percentage of households with no vehicle available in the United States with a correlation coefficient (R) of 0.102 and weighted average of 8.4%, a difference of 22.3%.
No Vehicles in Household Correlation Summary
| Measurement | Indonesian | Cajun |
| Minimum | 0.37% | 0.38% |
| Maximum | 26.9% | 21.2% |
| Range | 26.5% | 20.8% |
| Mean | 9.7% | 7.7% |
| Median | 9.1% | 7.3% |
| Interquartile 25% (IQ1) | 7.0% | 5.0% |
| Interquartile 75% (IQ3) | 11.3% | 9.5% |
| Interquartile Range (IQR) | 4.3% | 4.5% |
| Standard Deviation (Sample) | 5.6% | 3.9% |
| Standard Deviation (Population) | 5.6% | 3.9% |
Similar Demographics by No Vehicles in Household
Demographics Similar to Indonesians by No Vehicles in Household
In terms of no vehicles in household, the demographic groups most similar to Indonesians are Lumbee (10.3%, a difference of 0.27%), Immigrants from Saudi Arabia (10.3%, a difference of 0.29%), Immigrants from Latin America (10.4%, a difference of 0.48%), Immigrants from Costa Rica (10.3%, a difference of 0.54%), and Hmong (10.4%, a difference of 0.55%).
| Demographics | Rating | Rank | No Vehicles in Household |
| New Zealanders | 65.1 /100 | #161 | Good 10.2% |
| Immigrants | Austria | 64.4 /100 | #162 | Good 10.2% |
| Immigrants | Cambodia | 63.7 /100 | #163 | Good 10.2% |
| South Africans | 61.1 /100 | #164 | Good 10.2% |
| Comanche | 60.8 /100 | #165 | Good 10.2% |
| Immigrants | Costa Rica | 60.5 /100 | #166 | Good 10.3% |
| Immigrants | Saudi Arabia | 58.8 /100 | #167 | Average 10.3% |
| Indonesians | 56.7 /100 | #168 | Average 10.3% |
| Lumbee | 54.7 /100 | #169 | Average 10.3% |
| Immigrants | Latin America | 53.2 /100 | #170 | Average 10.4% |
| Hmong | 52.7 /100 | #171 | Average 10.4% |
| Brazilians | 51.7 /100 | #172 | Average 10.4% |
| Filipinos | 50.1 /100 | #173 | Average 10.4% |
| Immigrants | Sudan | 50.0 /100 | #174 | Average 10.4% |
| Immigrants | Burma/Myanmar | 49.1 /100 | #175 | Average 10.4% |
Demographics Similar to Cajuns by No Vehicles in Household
In terms of no vehicles in household, the demographic groups most similar to Cajuns are Immigrants from Lebanon (8.4%, a difference of 0.030%), Lithuanian (8.4%, a difference of 0.060%), Polish (8.4%, a difference of 0.090%), Spaniard (8.4%, a difference of 0.72%), and Immigrants from Iran (8.4%, a difference of 0.78%).
| Demographics | Rating | Rank | No Vehicles in Household |
| Slovaks | 99.8 /100 | #63 | Exceptional 8.3% |
| Croatians | 99.8 /100 | #64 | Exceptional 8.3% |
| Canadians | 99.7 /100 | #65 | Exceptional 8.3% |
| Palestinians | 99.7 /100 | #66 | Exceptional 8.3% |
| Immigrants | Scotland | 99.7 /100 | #67 | Exceptional 8.3% |
| Immigrants | Iran | 99.7 /100 | #68 | Exceptional 8.4% |
| Spaniards | 99.7 /100 | #69 | Exceptional 8.4% |
| Cajuns | 99.6 /100 | #70 | Exceptional 8.4% |
| Immigrants | Lebanon | 99.6 /100 | #71 | Exceptional 8.4% |
| Lithuanians | 99.6 /100 | #72 | Exceptional 8.4% |
| Poles | 99.6 /100 | #73 | Exceptional 8.4% |
| Cubans | 99.5 /100 | #74 | Exceptional 8.5% |
| Jordanians | 99.5 /100 | #75 | Exceptional 8.5% |
| Immigrants | Philippines | 99.5 /100 | #76 | Exceptional 8.5% |
| Iranians | 99.5 /100 | #77 | Exceptional 8.6% |