Immigrants from Pakistan vs Immigrants from Brazil Single Father Households
COMPARE
Immigrants from Pakistan
Immigrants from Brazil
Single Father Households
Single Father Households Comparison
Immigrants from Pakistan
Immigrants from Brazil
2.1%
SINGLE FATHER HOUSEHOLDS
99.5/ 100
METRIC RATING
90th/ 347
METRIC RANK
2.2%
SINGLE FATHER HOUSEHOLDS
97.7/ 100
METRIC RATING
121st/ 347
METRIC RANK
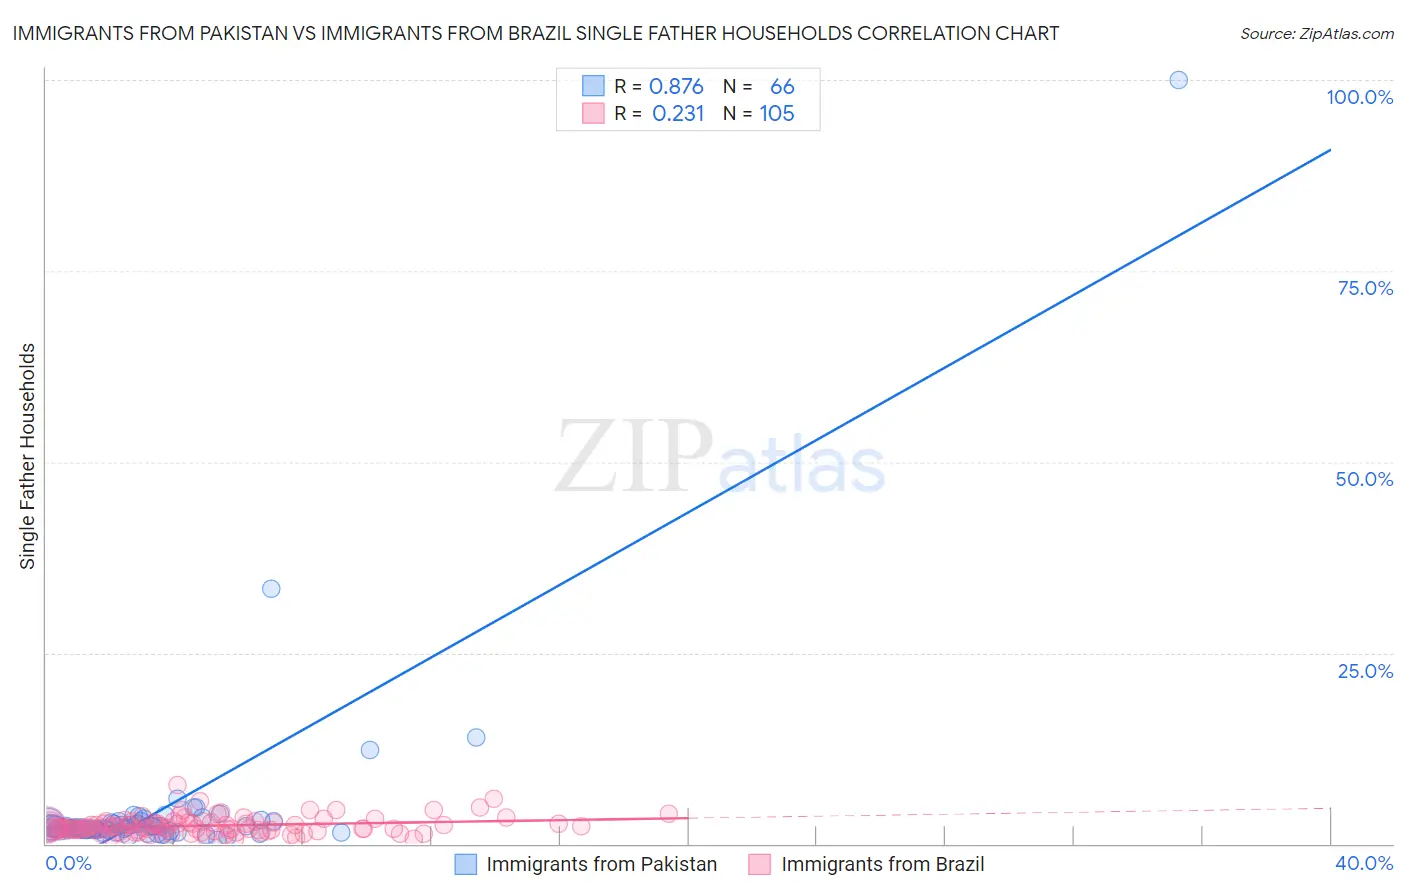
Immigrants from Pakistan vs Immigrants from Brazil Single Father Households Correlation Chart
The statistical analysis conducted on geographies consisting of 282,609,848 people shows a very strong positive correlation between the proportion of Immigrants from Pakistan and percentage of single father households in the United States with a correlation coefficient (R) of 0.876 and weighted average of 2.1%. Similarly, the statistical analysis conducted on geographies consisting of 340,503,881 people shows a weak positive correlation between the proportion of Immigrants from Brazil and percentage of single father households in the United States with a correlation coefficient (R) of 0.231 and weighted average of 2.2%, a difference of 2.9%.
Single Father Households Correlation Summary
| Measurement | Immigrants from Pakistan | Immigrants from Brazil |
| Minimum | 0.53% | 0.60% |
| Maximum | 100.0% | 7.7% |
| Range | 99.5% | 7.1% |
| Mean | 4.6% | 2.4% |
| Median | 2.2% | 2.1% |
| Interquartile 25% (IQ1) | 1.8% | 1.7% |
| Interquartile 75% (IQ3) | 2.9% | 2.8% |
| Interquartile Range (IQR) | 1.1% | 1.0% |
| Standard Deviation (Sample) | 12.7% | 1.1% |
| Standard Deviation (Population) | 12.6% | 1.1% |
Similar Demographics by Single Father Households
Demographics Similar to Immigrants from Pakistan by Single Father Households
In terms of single father households, the demographic groups most similar to Immigrants from Pakistan are Immigrants from Armenia (2.1%, a difference of 0.010%), Bhutanese (2.1%, a difference of 0.060%), Lithuanian (2.1%, a difference of 0.19%), Immigrants from Guyana (2.1%, a difference of 0.24%), and Romanian (2.1%, a difference of 0.33%).
| Demographics | Rating | Rank | Single Father Households |
| Greeks | 99.7 /100 | #83 | Exceptional 2.1% |
| Carpatho Rusyns | 99.6 /100 | #84 | Exceptional 2.1% |
| Immigrants | Hungary | 99.6 /100 | #85 | Exceptional 2.1% |
| Asians | 99.6 /100 | #86 | Exceptional 2.1% |
| Lithuanians | 99.5 /100 | #87 | Exceptional 2.1% |
| Bhutanese | 99.5 /100 | #88 | Exceptional 2.1% |
| Immigrants | Armenia | 99.5 /100 | #89 | Exceptional 2.1% |
| Immigrants | Pakistan | 99.5 /100 | #90 | Exceptional 2.1% |
| Immigrants | Guyana | 99.4 /100 | #91 | Exceptional 2.1% |
| Romanians | 99.4 /100 | #92 | Exceptional 2.1% |
| Croatians | 99.3 /100 | #93 | Exceptional 2.1% |
| Ukrainians | 99.3 /100 | #94 | Exceptional 2.1% |
| Bermudans | 99.2 /100 | #95 | Exceptional 2.1% |
| Arabs | 99.2 /100 | #96 | Exceptional 2.1% |
| Immigrants | Moldova | 99.1 /100 | #97 | Exceptional 2.1% |
Demographics Similar to Immigrants from Brazil by Single Father Households
In terms of single father households, the demographic groups most similar to Immigrants from Brazil are Australian (2.2%, a difference of 0.0%), Trinidadian and Tobagonian (2.2%, a difference of 0.040%), Immigrants from Morocco (2.2%, a difference of 0.090%), Immigrants from Iraq (2.2%, a difference of 0.10%), and Hungarian (2.2%, a difference of 0.19%).
| Demographics | Rating | Rank | Single Father Households |
| Immigrants | North America | 98.2 /100 | #114 | Exceptional 2.2% |
| Immigrants | Barbados | 98.2 /100 | #115 | Exceptional 2.2% |
| Immigrants | Argentina | 98.1 /100 | #116 | Exceptional 2.2% |
| Hungarians | 97.9 /100 | #117 | Exceptional 2.2% |
| Immigrants | Morocco | 97.8 /100 | #118 | Exceptional 2.2% |
| Trinidadians and Tobagonians | 97.8 /100 | #119 | Exceptional 2.2% |
| Australians | 97.7 /100 | #120 | Exceptional 2.2% |
| Immigrants | Brazil | 97.7 /100 | #121 | Exceptional 2.2% |
| Immigrants | Iraq | 97.6 /100 | #122 | Exceptional 2.2% |
| Immigrants | Yemen | 97.5 /100 | #123 | Exceptional 2.2% |
| British West Indians | 97.4 /100 | #124 | Exceptional 2.2% |
| Immigrants | Indonesia | 97.4 /100 | #125 | Exceptional 2.2% |
| Moroccans | 96.9 /100 | #126 | Exceptional 2.2% |
| Jordanians | 96.9 /100 | #127 | Exceptional 2.2% |
| Immigrants | England | 96.8 /100 | #128 | Exceptional 2.2% |