Immigrants from Zaire vs Syrian 5th Grade
COMPARE
Immigrants from Zaire
Syrian
5th Grade
5th Grade Comparison
Immigrants from Zaire
Syrians
97.1%
5TH GRADE
13.7/ 100
METRIC RATING
204th/ 347
METRIC RANK
97.6%
5TH GRADE
95.1/ 100
METRIC RATING
119th/ 347
METRIC RANK
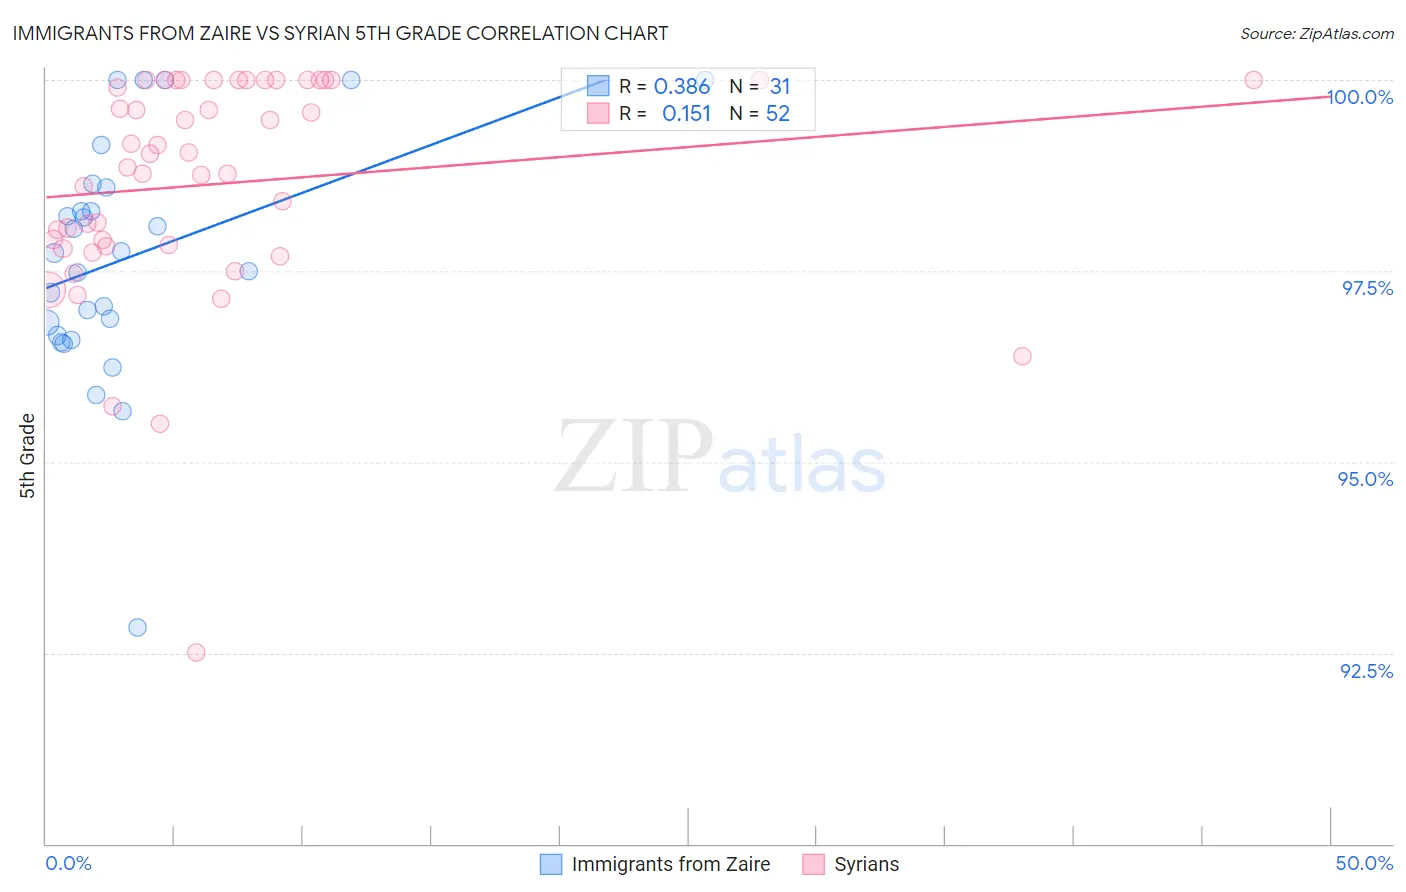
Immigrants from Zaire vs Syrian 5th Grade Correlation Chart
The statistical analysis conducted on geographies consisting of 107,212,695 people shows a mild positive correlation between the proportion of Immigrants from Zaire and percentage of population with at least 5th grade education in the United States with a correlation coefficient (R) of 0.386 and weighted average of 97.1%. Similarly, the statistical analysis conducted on geographies consisting of 266,305,988 people shows a poor positive correlation between the proportion of Syrians and percentage of population with at least 5th grade education in the United States with a correlation coefficient (R) of 0.151 and weighted average of 97.6%, a difference of 0.50%.
5th Grade Correlation Summary
| Measurement | Immigrants from Zaire | Syrian |
| Minimum | 92.8% | 92.5% |
| Maximum | 100.0% | 100.0% |
| Range | 7.2% | 7.5% |
| Mean | 97.7% | 98.6% |
| Median | 97.7% | 98.9% |
| Interquartile 25% (IQ1) | 96.7% | 97.8% |
| Interquartile 75% (IQ3) | 98.6% | 100.0% |
| Interquartile Range (IQR) | 1.9% | 2.2% |
| Standard Deviation (Sample) | 1.6% | 1.5% |
| Standard Deviation (Population) | 1.5% | 1.5% |
Similar Demographics by 5th Grade
Demographics Similar to Immigrants from Zaire by 5th Grade
In terms of 5th grade, the demographic groups most similar to Immigrants from Zaire are African (97.2%, a difference of 0.010%), Immigrants from Bahamas (97.2%, a difference of 0.010%), Immigrants from Northern Africa (97.2%, a difference of 0.020%), Immigrants from Chile (97.2%, a difference of 0.020%), and Moroccan (97.1%, a difference of 0.020%).
| Demographics | Rating | Rank | 5th Grade |
| Brazilians | 25.4 /100 | #197 | Fair 97.2% |
| Immigrants | Uganda | 21.1 /100 | #198 | Fair 97.2% |
| Natives/Alaskans | 18.0 /100 | #199 | Poor 97.2% |
| Immigrants | Northern Africa | 16.8 /100 | #200 | Poor 97.2% |
| Immigrants | Chile | 16.6 /100 | #201 | Poor 97.2% |
| Africans | 15.3 /100 | #202 | Poor 97.2% |
| Immigrants | Bahamas | 14.9 /100 | #203 | Poor 97.2% |
| Immigrants | Zaire | 13.7 /100 | #204 | Poor 97.1% |
| Moroccans | 12.0 /100 | #205 | Poor 97.1% |
| Paiute | 11.6 /100 | #206 | Poor 97.1% |
| Iraqis | 10.9 /100 | #207 | Poor 97.1% |
| Laotians | 10.8 /100 | #208 | Poor 97.1% |
| Immigrants | Nepal | 10.3 /100 | #209 | Poor 97.1% |
| Immigrants | Oceania | 10.0 /100 | #210 | Poor 97.1% |
| Samoans | 8.5 /100 | #211 | Tragic 97.1% |
Demographics Similar to Syrians by 5th Grade
In terms of 5th grade, the demographic groups most similar to Syrians are Basque (97.6%, a difference of 0.0%), Immigrants from Zimbabwe (97.6%, a difference of 0.0%), Immigrants from Croatia (97.6%, a difference of 0.010%), Immigrants from Saudi Arabia (97.6%, a difference of 0.010%), and Immigrants from France (97.6%, a difference of 0.010%).
| Demographics | Rating | Rank | 5th Grade |
| Immigrants | Switzerland | 96.0 /100 | #112 | Exceptional 97.7% |
| Iroquois | 95.9 /100 | #113 | Exceptional 97.7% |
| Lebanese | 95.7 /100 | #114 | Exceptional 97.6% |
| Okinawans | 95.7 /100 | #115 | Exceptional 97.6% |
| Immigrants | Croatia | 95.5 /100 | #116 | Exceptional 97.6% |
| Immigrants | Saudi Arabia | 95.4 /100 | #117 | Exceptional 97.6% |
| Basques | 95.2 /100 | #118 | Exceptional 97.6% |
| Syrians | 95.1 /100 | #119 | Exceptional 97.6% |
| Immigrants | Zimbabwe | 94.9 /100 | #120 | Exceptional 97.6% |
| Immigrants | France | 94.8 /100 | #121 | Exceptional 97.6% |
| Immigrants | Japan | 94.7 /100 | #122 | Exceptional 97.6% |
| Immigrants | Norway | 94.6 /100 | #123 | Exceptional 97.6% |
| Spanish | 93.7 /100 | #124 | Exceptional 97.6% |
| Immigrants | Bulgaria | 93.1 /100 | #125 | Exceptional 97.6% |
| Hmong | 92.3 /100 | #126 | Exceptional 97.6% |