Immigrants from Zaire vs Hmong Single Mother Households
COMPARE
Immigrants from Zaire
Hmong
Single Mother Households
Single Mother Households Comparison
Immigrants from Zaire
Hmong
7.4%
SINGLE MOTHER HOUSEHOLDS
0.2/ 100
METRIC RATING
260th/ 347
METRIC RANK
6.4%
SINGLE MOTHER HOUSEHOLDS
39.8/ 100
METRIC RATING
179th/ 347
METRIC RANK
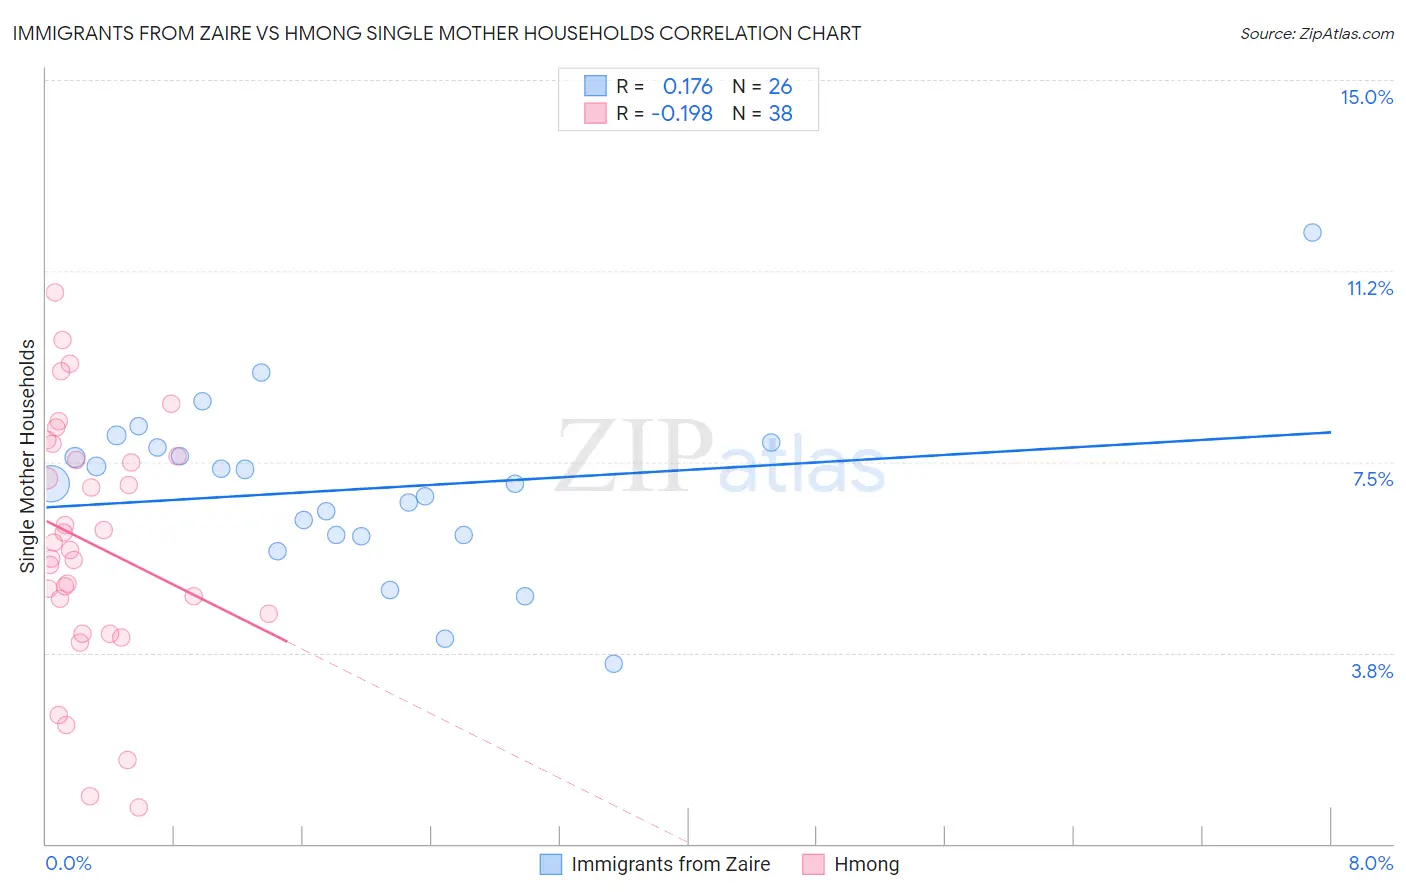
Immigrants from Zaire vs Hmong Single Mother Households Correlation Chart
The statistical analysis conducted on geographies consisting of 107,226,907 people shows a poor positive correlation between the proportion of Immigrants from Zaire and percentage of single mother households in the United States with a correlation coefficient (R) of 0.176 and weighted average of 7.4%. Similarly, the statistical analysis conducted on geographies consisting of 24,669,739 people shows a poor negative correlation between the proportion of Hmong and percentage of single mother households in the United States with a correlation coefficient (R) of -0.198 and weighted average of 6.4%, a difference of 16.0%.
Single Mother Households Correlation Summary
| Measurement | Immigrants from Zaire | Hmong |
| Minimum | 3.5% | 0.72% |
| Maximum | 12.0% | 10.8% |
| Range | 8.5% | 10.1% |
| Mean | 7.0% | 5.9% |
| Median | 7.1% | 5.8% |
| Interquartile 25% (IQ1) | 6.1% | 4.5% |
| Interquartile 75% (IQ3) | 7.8% | 7.6% |
| Interquartile Range (IQR) | 1.7% | 3.1% |
| Standard Deviation (Sample) | 1.7% | 2.4% |
| Standard Deviation (Population) | 1.7% | 2.4% |
Similar Demographics by Single Mother Households
Demographics Similar to Immigrants from Zaire by Single Mother Households
In terms of single mother households, the demographic groups most similar to Immigrants from Zaire are Japanese (7.4%, a difference of 0.020%), Immigrants from Yemen (7.4%, a difference of 0.040%), Pueblo (7.4%, a difference of 0.060%), Alaska Native (7.4%, a difference of 0.080%), and Seminole (7.4%, a difference of 0.13%).
| Demographics | Rating | Rank | Single Mother Households |
| Cajuns | 0.3 /100 | #253 | Tragic 7.3% |
| Immigrants | Ecuador | 0.3 /100 | #254 | Tragic 7.3% |
| Mexican American Indians | 0.2 /100 | #255 | Tragic 7.4% |
| Seminole | 0.2 /100 | #256 | Tragic 7.4% |
| Alaska Natives | 0.2 /100 | #257 | Tragic 7.4% |
| Pueblo | 0.2 /100 | #258 | Tragic 7.4% |
| Immigrants | Yemen | 0.2 /100 | #259 | Tragic 7.4% |
| Immigrants | Zaire | 0.2 /100 | #260 | Tragic 7.4% |
| Japanese | 0.2 /100 | #261 | Tragic 7.4% |
| Immigrants | Somalia | 0.2 /100 | #262 | Tragic 7.4% |
| Immigrants | Nicaragua | 0.2 /100 | #263 | Tragic 7.4% |
| Yaqui | 0.1 /100 | #264 | Tragic 7.4% |
| Crow | 0.1 /100 | #265 | Tragic 7.4% |
| Nepalese | 0.1 /100 | #266 | Tragic 7.5% |
| Blackfeet | 0.1 /100 | #267 | Tragic 7.5% |
Demographics Similar to Hmong by Single Mother Households
In terms of single mother households, the demographic groups most similar to Hmong are Portuguese (6.4%, a difference of 0.020%), Osage (6.4%, a difference of 0.36%), Immigrants from Nepal (6.4%, a difference of 0.43%), Immigrants from Bosnia and Herzegovina (6.3%, a difference of 0.51%), and Marshallese (6.3%, a difference of 0.67%).
| Demographics | Rating | Rank | Single Mother Households |
| Immigrants | South Eastern Asia | 52.2 /100 | #172 | Average 6.3% |
| Immigrants | Vietnam | 51.5 /100 | #173 | Average 6.3% |
| Immigrants | Morocco | 50.0 /100 | #174 | Average 6.3% |
| Marshallese | 45.8 /100 | #175 | Average 6.3% |
| Immigrants | Bosnia and Herzegovina | 44.3 /100 | #176 | Average 6.3% |
| Osage | 43.0 /100 | #177 | Average 6.4% |
| Portuguese | 40.0 /100 | #178 | Fair 6.4% |
| Hmong | 39.8 /100 | #179 | Fair 6.4% |
| Immigrants | Nepal | 36.1 /100 | #180 | Fair 6.4% |
| Spanish | 33.4 /100 | #181 | Fair 6.4% |
| South American Indians | 33.4 /100 | #182 | Fair 6.4% |
| Spaniards | 27.8 /100 | #183 | Fair 6.5% |
| Ethiopians | 26.0 /100 | #184 | Fair 6.5% |
| Ugandans | 25.6 /100 | #185 | Fair 6.5% |
| Costa Ricans | 24.8 /100 | #186 | Fair 6.5% |