Immigrants from Zaire vs Pima Median Family Income
COMPARE
Immigrants from Zaire
Pima
Median Family Income
Median Family Income Comparison
Immigrants from Zaire
Pima
$89,285
MEDIAN FAMILY INCOME
0.1/ 100
METRIC RATING
276th/ 347
METRIC RANK
$77,431
MEDIAN FAMILY INCOME
0.0/ 100
METRIC RATING
339th/ 347
METRIC RANK
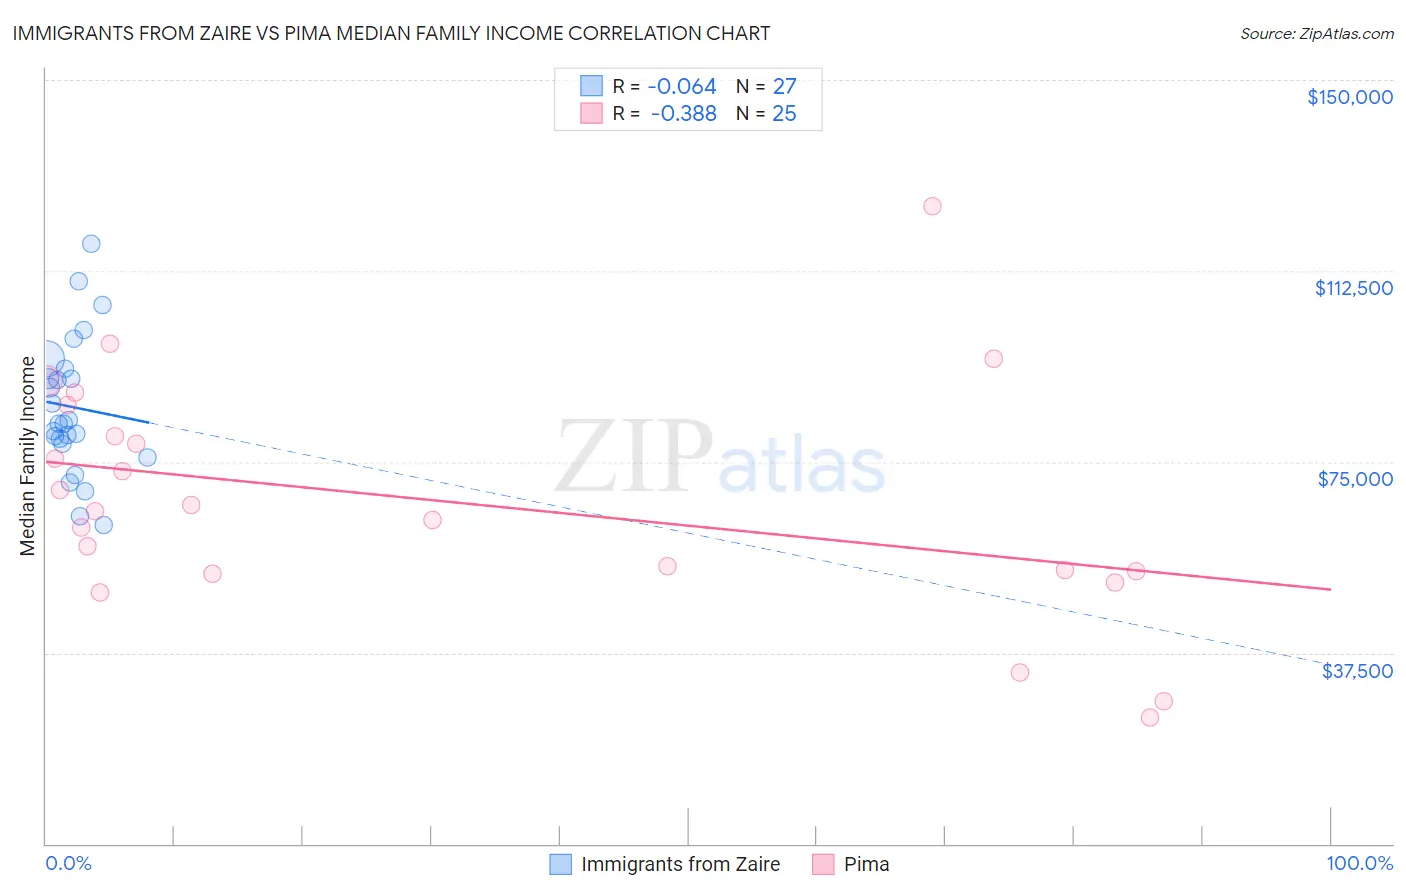
Immigrants from Zaire vs Pima Median Family Income Correlation Chart
The statistical analysis conducted on geographies consisting of 107,241,539 people shows a slight negative correlation between the proportion of Immigrants from Zaire and median family income in the United States with a correlation coefficient (R) of -0.064 and weighted average of $89,285. Similarly, the statistical analysis conducted on geographies consisting of 61,529,758 people shows a mild negative correlation between the proportion of Pima and median family income in the United States with a correlation coefficient (R) of -0.388 and weighted average of $77,431, a difference of 15.3%.
Median Family Income Correlation Summary
| Measurement | Immigrants from Zaire | Pima |
| Minimum | $62,631 | $24,821 |
| Maximum | $117,948 | $125,278 |
| Range | $55,317 | $100,457 |
| Mean | $85,792 | $67,157 |
| Median | $82,545 | $65,417 |
| Interquartile 25% (IQ1) | $78,573 | $53,298 |
| Interquartile 75% (IQ3) | $93,272 | $83,045 |
| Interquartile Range (IQR) | $14,699 | $29,747 |
| Standard Deviation (Sample) | $13,444 | $23,070 |
| Standard Deviation (Population) | $13,193 | $22,604 |
Similar Demographics by Median Family Income
Demographics Similar to Immigrants from Zaire by Median Family Income
In terms of median family income, the demographic groups most similar to Immigrants from Zaire are Immigrants from Jamaica ($89,268, a difference of 0.020%), Immigrants from Grenada ($89,249, a difference of 0.040%), Immigrants from Belize ($89,197, a difference of 0.10%), British West Indian ($88,987, a difference of 0.33%), and Blackfeet ($88,717, a difference of 0.64%).
| Demographics | Rating | Rank | Median Family Income |
| Belizeans | 0.2 /100 | #269 | Tragic $90,880 |
| Jamaicans | 0.2 /100 | #270 | Tragic $90,581 |
| Iroquois | 0.2 /100 | #271 | Tragic $90,543 |
| Immigrants | Liberia | 0.2 /100 | #272 | Tragic $90,450 |
| Immigrants | Micronesia | 0.2 /100 | #273 | Tragic $90,345 |
| Spanish Americans | 0.2 /100 | #274 | Tragic $90,322 |
| Immigrants | St. Vincent and the Grenadines | 0.2 /100 | #275 | Tragic $90,094 |
| Immigrants | Zaire | 0.1 /100 | #276 | Tragic $89,285 |
| Immigrants | Jamaica | 0.1 /100 | #277 | Tragic $89,268 |
| Immigrants | Grenada | 0.1 /100 | #278 | Tragic $89,249 |
| Immigrants | Belize | 0.1 /100 | #279 | Tragic $89,197 |
| British West Indians | 0.1 /100 | #280 | Tragic $88,987 |
| Blackfeet | 0.1 /100 | #281 | Tragic $88,717 |
| Comanche | 0.1 /100 | #282 | Tragic $88,556 |
| Bangladeshis | 0.1 /100 | #283 | Tragic $88,358 |
Demographics Similar to Pima by Median Family Income
In terms of median family income, the demographic groups most similar to Pima are Immigrants from Yemen ($77,457, a difference of 0.030%), Hopi ($77,188, a difference of 0.32%), Pueblo ($76,880, a difference of 0.72%), Yuman ($78,055, a difference of 0.80%), and Immigrants from Cuba ($78,249, a difference of 1.1%).
| Demographics | Rating | Rank | Median Family Income |
| Natives/Alaskans | 0.0 /100 | #332 | Tragic $80,908 |
| Kiowa | 0.0 /100 | #333 | Tragic $80,885 |
| Menominee | 0.0 /100 | #334 | Tragic $79,563 |
| Yup'ik | 0.0 /100 | #335 | Tragic $79,290 |
| Immigrants | Cuba | 0.0 /100 | #336 | Tragic $78,249 |
| Yuman | 0.0 /100 | #337 | Tragic $78,055 |
| Immigrants | Yemen | 0.0 /100 | #338 | Tragic $77,457 |
| Pima | 0.0 /100 | #339 | Tragic $77,431 |
| Hopi | 0.0 /100 | #340 | Tragic $77,188 |
| Pueblo | 0.0 /100 | #341 | Tragic $76,880 |
| Crow | 0.0 /100 | #342 | Tragic $76,605 |
| Houma | 0.0 /100 | #343 | Tragic $76,188 |
| Tohono O'odham | 0.0 /100 | #344 | Tragic $72,193 |
| Navajo | 0.0 /100 | #345 | Tragic $70,989 |
| Puerto Ricans | 0.0 /100 | #346 | Tragic $70,423 |