Immigrants from Zaire vs Pima Unemployment Among Ages 16 to 19 years
COMPARE
Immigrants from Zaire
Pima
Unemployment Among Ages 16 to 19 years
Unemployment Among Ages 16 to 19 years Comparison
Immigrants from Zaire
Pima
15.6%
UNEMPLOYMENT AMONG AGES 16 TO 19 YEARS
100.0/ 100
METRIC RATING
14th/ 347
METRIC RANK
23.1%
UNEMPLOYMENT AMONG AGES 16 TO 19 YEARS
0.0/ 100
METRIC RATING
327th/ 347
METRIC RANK
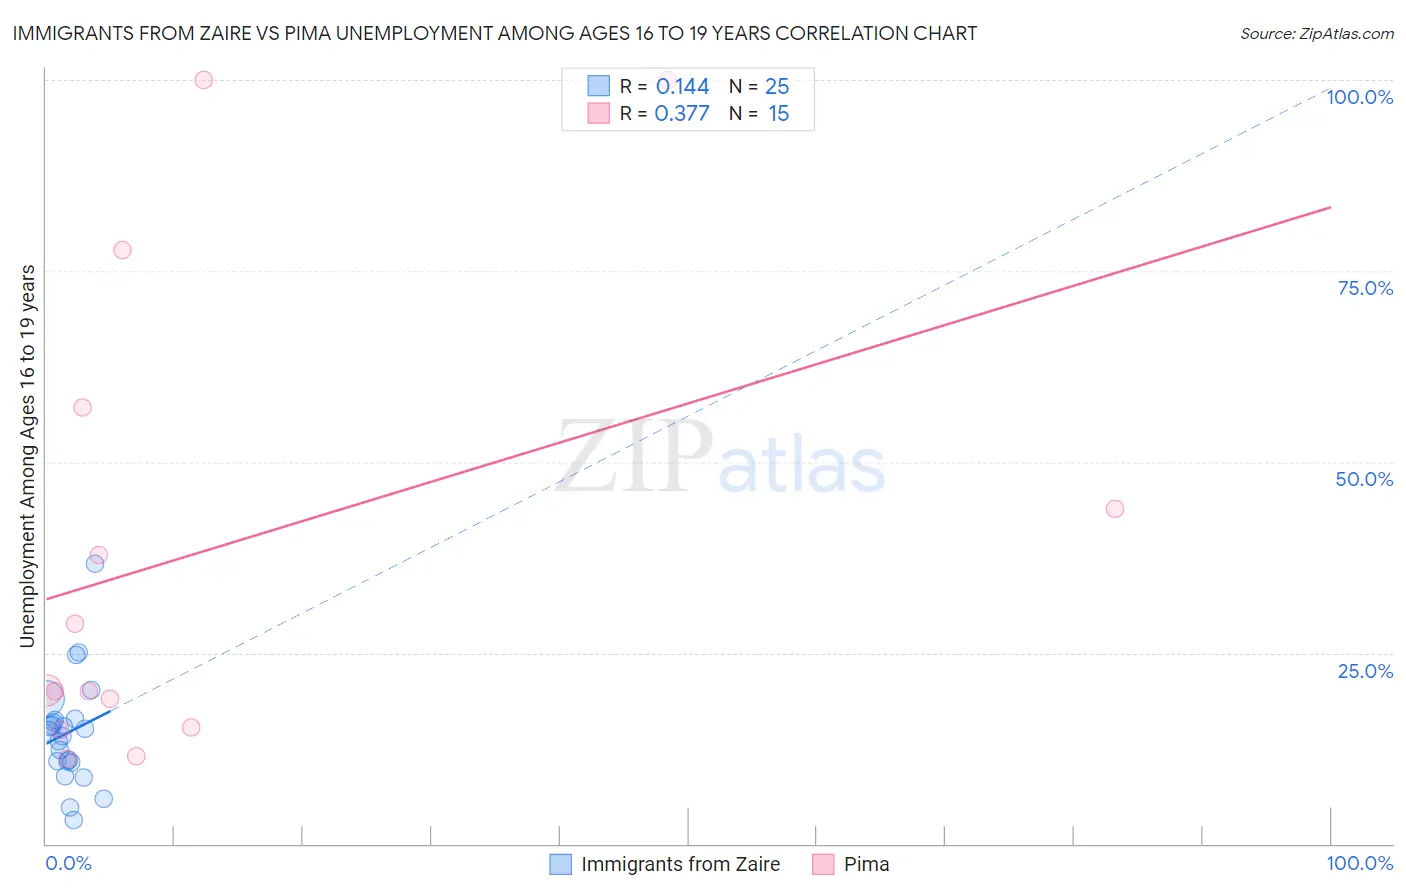
Immigrants from Zaire vs Pima Unemployment Among Ages 16 to 19 years Correlation Chart
The statistical analysis conducted on geographies consisting of 106,126,404 people shows a poor positive correlation between the proportion of Immigrants from Zaire and unemployment rate among population between the ages 16 and 19 in the United States with a correlation coefficient (R) of 0.144 and weighted average of 15.6%. Similarly, the statistical analysis conducted on geographies consisting of 60,760,058 people shows a mild positive correlation between the proportion of Pima and unemployment rate among population between the ages 16 and 19 in the United States with a correlation coefficient (R) of 0.377 and weighted average of 23.1%, a difference of 48.2%.
Unemployment Among Ages 16 to 19 years Correlation Summary
| Measurement | Immigrants from Zaire | Pima |
| Minimum | 3.1% | 11.1% |
| Maximum | 36.7% | 100.0% |
| Range | 33.6% | 88.9% |
| Mean | 14.6% | 38.5% |
| Median | 14.7% | 20.1% |
| Interquartile 25% (IQ1) | 10.7% | 15.3% |
| Interquartile 75% (IQ3) | 16.3% | 57.1% |
| Interquartile Range (IQR) | 5.6% | 41.8% |
| Standard Deviation (Sample) | 7.1% | 31.1% |
| Standard Deviation (Population) | 6.9% | 30.1% |
Similar Demographics by Unemployment Among Ages 16 to 19 years
Demographics Similar to Immigrants from Zaire by Unemployment Among Ages 16 to 19 years
In terms of unemployment among ages 16 to 19 years, the demographic groups most similar to Immigrants from Zaire are Yugoslavian (15.6%, a difference of 0.050%), Immigrants from Burma/Myanmar (15.6%, a difference of 0.14%), German (15.7%, a difference of 0.34%), Somali (15.7%, a difference of 0.55%), and Taiwanese (15.5%, a difference of 0.58%).
| Demographics | Rating | Rank | Unemployment Among Ages 16 to 19 years |
| Immigrants | Bosnia and Herzegovina | 100.0 /100 | #7 | Exceptional 15.3% |
| Czechs | 100.0 /100 | #8 | Exceptional 15.4% |
| Scandinavians | 100.0 /100 | #9 | Exceptional 15.4% |
| Zimbabweans | 100.0 /100 | #10 | Exceptional 15.4% |
| Indonesians | 100.0 /100 | #11 | Exceptional 15.5% |
| Taiwanese | 100.0 /100 | #12 | Exceptional 15.5% |
| Immigrants | Burma/Myanmar | 100.0 /100 | #13 | Exceptional 15.6% |
| Immigrants | Zaire | 100.0 /100 | #14 | Exceptional 15.6% |
| Yugoslavians | 100.0 /100 | #15 | Exceptional 15.6% |
| Germans | 100.0 /100 | #16 | Exceptional 15.7% |
| Somalis | 100.0 /100 | #17 | Exceptional 15.7% |
| Thais | 100.0 /100 | #18 | Exceptional 15.7% |
| Swiss | 100.0 /100 | #19 | Exceptional 15.8% |
| Sudanese | 100.0 /100 | #20 | Exceptional 15.8% |
| Immigrants | Taiwan | 100.0 /100 | #21 | Exceptional 15.8% |
Demographics Similar to Pima by Unemployment Among Ages 16 to 19 years
In terms of unemployment among ages 16 to 19 years, the demographic groups most similar to Pima are Immigrants from Trinidad and Tobago (23.1%, a difference of 0.26%), Immigrants from Dominican Republic (23.3%, a difference of 0.66%), Tlingit-Haida (23.5%, a difference of 1.7%), Dominican (23.6%, a difference of 2.2%), and Trinidadian and Tobagonian (22.6%, a difference of 2.3%).
| Demographics | Rating | Rank | Unemployment Among Ages 16 to 19 years |
| Cheyenne | 0.0 /100 | #320 | Tragic 22.3% |
| West Indians | 0.0 /100 | #321 | Tragic 22.4% |
| Barbadians | 0.0 /100 | #322 | Tragic 22.5% |
| Yakama | 0.0 /100 | #323 | Tragic 22.5% |
| Immigrants | Armenia | 0.0 /100 | #324 | Tragic 22.6% |
| Trinidadians and Tobagonians | 0.0 /100 | #325 | Tragic 22.6% |
| Immigrants | Trinidad and Tobago | 0.0 /100 | #326 | Tragic 23.1% |
| Pima | 0.0 /100 | #327 | Tragic 23.1% |
| Immigrants | Dominican Republic | 0.0 /100 | #328 | Tragic 23.3% |
| Tlingit-Haida | 0.0 /100 | #329 | Tragic 23.5% |
| Dominicans | 0.0 /100 | #330 | Tragic 23.6% |
| British West Indians | 0.0 /100 | #331 | Tragic 24.0% |
| Immigrants | Barbados | 0.0 /100 | #332 | Tragic 24.0% |
| Paiute | 0.0 /100 | #333 | Tragic 24.4% |
| Guyanese | 0.0 /100 | #334 | Tragic 24.8% |