Immigrants from Eastern Europe vs Immigrants from Barbados Married-couple Households
COMPARE
Immigrants from Eastern Europe
Immigrants from Barbados
Married-couple Households
Married-couple Households Comparison
Immigrants from Eastern Europe
Immigrants from Barbados
47.4%
MARRIED-COUPLE HOUSEHOLDS
90.3/ 100
METRIC RATING
121st/ 347
METRIC RANK
39.2%
MARRIED-COUPLE HOUSEHOLDS
0.0/ 100
METRIC RATING
330th/ 347
METRIC RANK
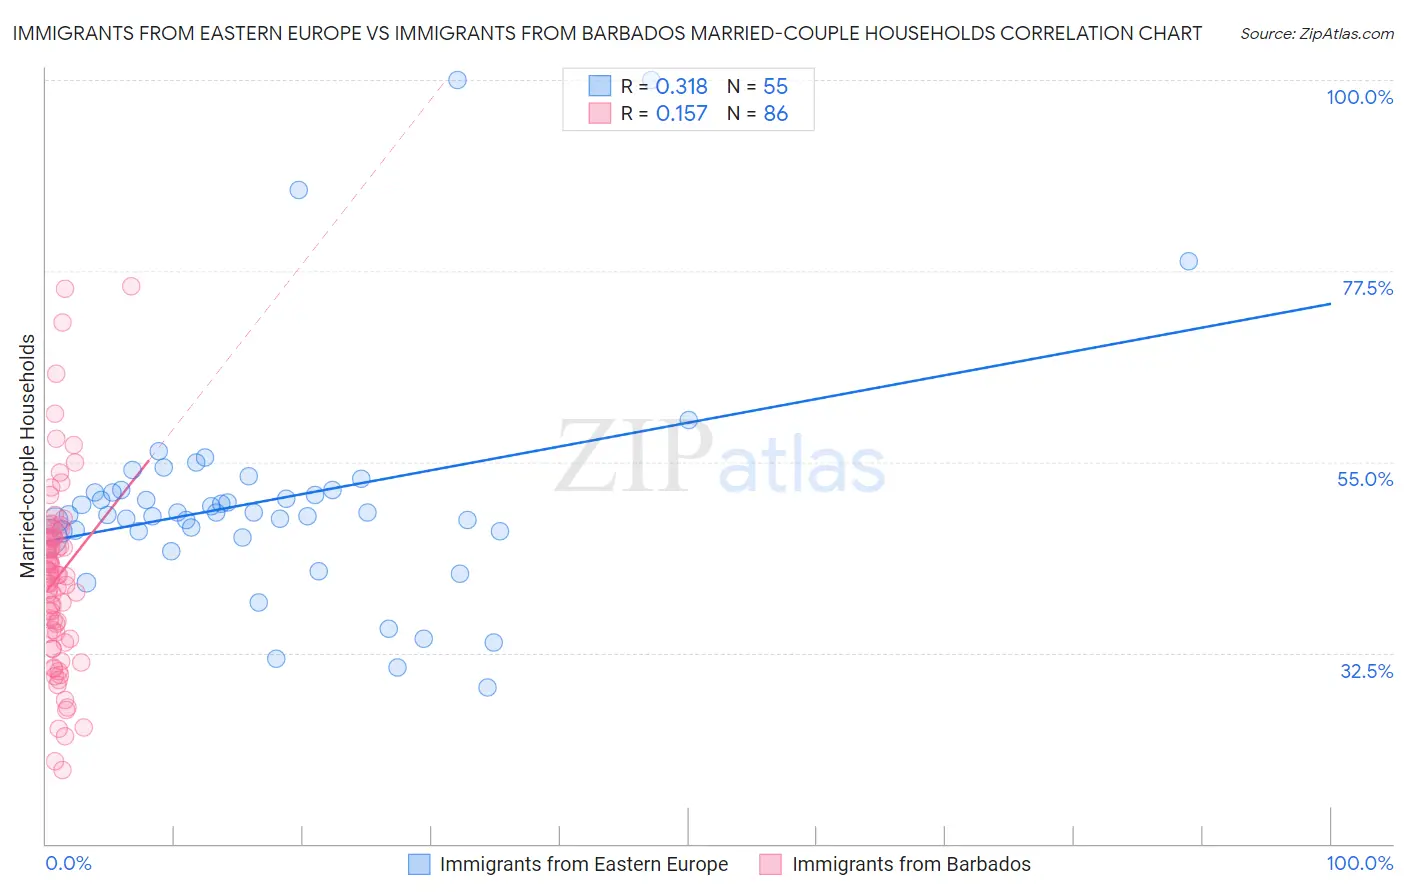
Immigrants from Eastern Europe vs Immigrants from Barbados Married-couple Households Correlation Chart
The statistical analysis conducted on geographies consisting of 475,489,582 people shows a mild positive correlation between the proportion of Immigrants from Eastern Europe and percentage of married-couple family households in the United States with a correlation coefficient (R) of 0.318 and weighted average of 47.4%. Similarly, the statistical analysis conducted on geographies consisting of 112,771,790 people shows a poor positive correlation between the proportion of Immigrants from Barbados and percentage of married-couple family households in the United States with a correlation coefficient (R) of 0.157 and weighted average of 39.2%, a difference of 21.0%.
Married-couple Households Correlation Summary
| Measurement | Immigrants from Eastern Europe | Immigrants from Barbados |
| Minimum | 28.4% | 18.6% |
| Maximum | 100.0% | 75.7% |
| Range | 71.6% | 57.1% |
| Mean | 50.5% | 41.4% |
| Median | 49.0% | 41.6% |
| Interquartile 25% (IQ1) | 46.8% | 34.8% |
| Interquartile 75% (IQ3) | 51.7% | 46.1% |
| Interquartile Range (IQR) | 4.9% | 11.3% |
| Standard Deviation (Sample) | 13.5% | 11.0% |
| Standard Deviation (Population) | 13.4% | 10.9% |
Similar Demographics by Married-couple Households
Demographics Similar to Immigrants from Eastern Europe by Married-couple Households
In terms of married-couple households, the demographic groups most similar to Immigrants from Eastern Europe are Puget Sound Salish (47.4%, a difference of 0.020%), Okinawan (47.4%, a difference of 0.020%), Immigrants from Venezuela (47.4%, a difference of 0.10%), Zimbabwean (47.4%, a difference of 0.11%), and Australian (47.4%, a difference of 0.13%).
| Demographics | Rating | Rank | Married-couple Households |
| Immigrants | Europe | 93.7 /100 | #114 | Exceptional 47.6% |
| Slovaks | 92.9 /100 | #115 | Exceptional 47.6% |
| Argentineans | 92.5 /100 | #116 | Exceptional 47.5% |
| French Canadians | 92.4 /100 | #117 | Exceptional 47.5% |
| Immigrants | Germany | 92.4 /100 | #118 | Exceptional 47.5% |
| Chileans | 92.2 /100 | #119 | Exceptional 47.5% |
| Puget Sound Salish | 90.5 /100 | #120 | Exceptional 47.4% |
| Immigrants | Eastern Europe | 90.3 /100 | #121 | Exceptional 47.4% |
| Okinawans | 90.1 /100 | #122 | Exceptional 47.4% |
| Immigrants | Venezuela | 89.3 /100 | #123 | Excellent 47.4% |
| Zimbabweans | 89.2 /100 | #124 | Excellent 47.4% |
| Australians | 89.0 /100 | #125 | Excellent 47.4% |
| Pakistanis | 88.6 /100 | #126 | Excellent 47.3% |
| Celtics | 88.1 /100 | #127 | Excellent 47.3% |
| Immigrants | Peru | 87.9 /100 | #128 | Excellent 47.3% |
Demographics Similar to Immigrants from Barbados by Married-couple Households
In terms of married-couple households, the demographic groups most similar to Immigrants from Barbados are Immigrants from Dominica (39.4%, a difference of 0.44%), Immigrants from Congo (39.0%, a difference of 0.44%), Barbadian (39.4%, a difference of 0.52%), Somali (39.0%, a difference of 0.52%), and Immigrants from West Indies (39.0%, a difference of 0.56%).
| Demographics | Rating | Rank | Married-couple Households |
| Puerto Ricans | 0.0 /100 | #323 | Tragic 40.1% |
| Navajo | 0.0 /100 | #324 | Tragic 40.1% |
| Pueblo | 0.0 /100 | #325 | Tragic 40.0% |
| U.S. Virgin Islanders | 0.0 /100 | #326 | Tragic 39.8% |
| Lumbee | 0.0 /100 | #327 | Tragic 39.6% |
| Barbadians | 0.0 /100 | #328 | Tragic 39.4% |
| Immigrants | Dominica | 0.0 /100 | #329 | Tragic 39.4% |
| Immigrants | Barbados | 0.0 /100 | #330 | Tragic 39.2% |
| Immigrants | Congo | 0.0 /100 | #331 | Tragic 39.0% |
| Somalis | 0.0 /100 | #332 | Tragic 39.0% |
| Immigrants | West Indies | 0.0 /100 | #333 | Tragic 39.0% |
| Immigrants | St. Vincent and the Grenadines | 0.0 /100 | #334 | Tragic 38.7% |
| Senegalese | 0.0 /100 | #335 | Tragic 38.6% |
| Blacks/African Americans | 0.0 /100 | #336 | Tragic 38.5% |
| Immigrants | Somalia | 0.0 /100 | #337 | Tragic 38.4% |