German vs Tlingit-Haida Average Family Size
COMPARE
German
Tlingit-Haida
Average Family Size
Average Family Size Comparison
Germans
Tlingit-Haida
3.09
AVERAGE FAMILY SIZE
0.0/ 100
METRIC RATING
342nd/ 347
METRIC RANK
3.16
AVERAGE FAMILY SIZE
0.7/ 100
METRIC RATING
270th/ 347
METRIC RANK
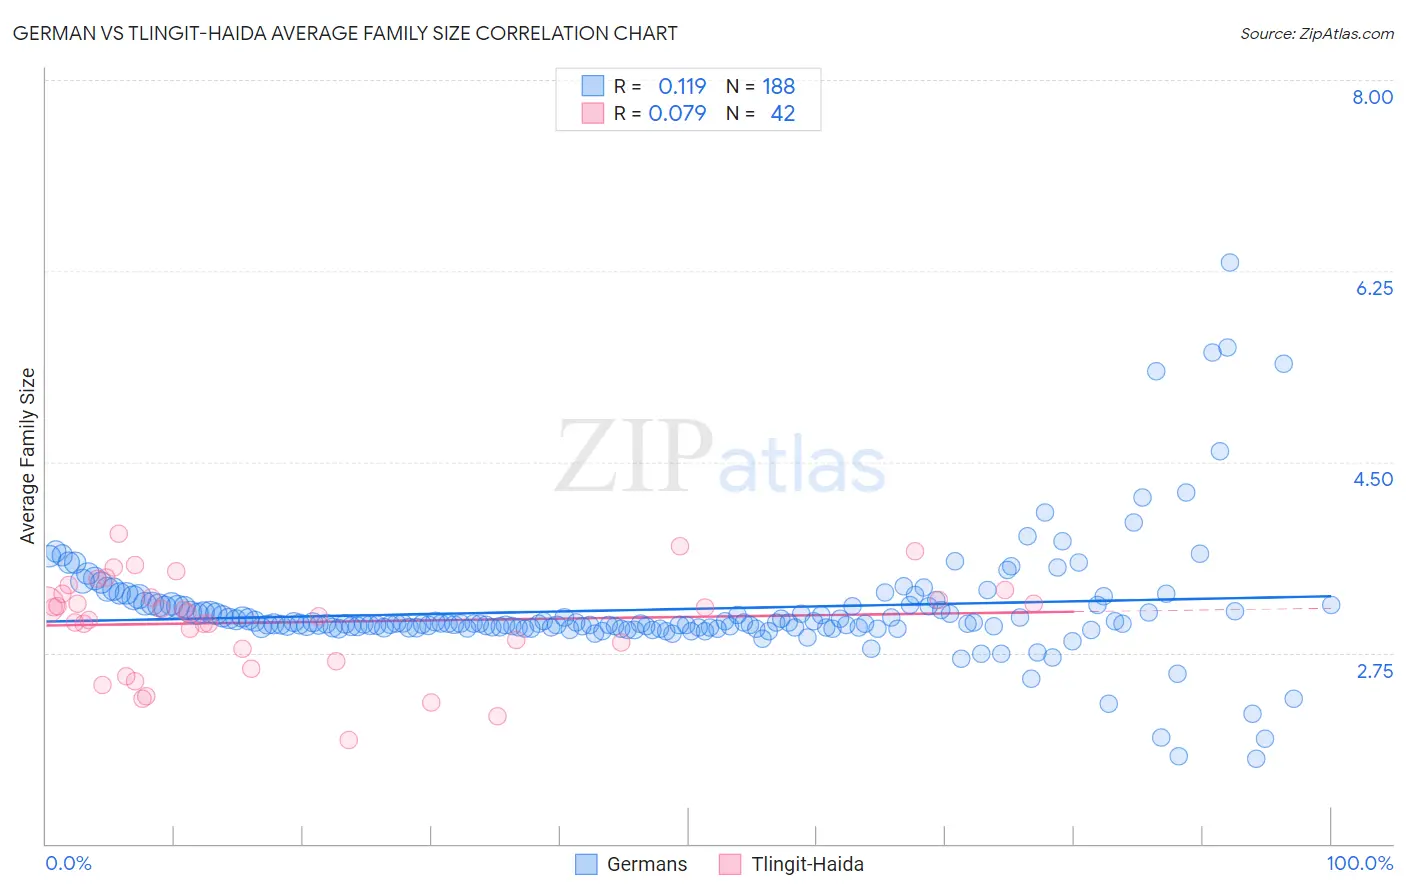
German vs Tlingit-Haida Average Family Size Correlation Chart
The statistical analysis conducted on geographies consisting of 580,609,080 people shows a poor positive correlation between the proportion of Germans and average family size in the United States with a correlation coefficient (R) of 0.119 and weighted average of 3.09. Similarly, the statistical analysis conducted on geographies consisting of 60,855,605 people shows a slight positive correlation between the proportion of Tlingit-Haida and average family size in the United States with a correlation coefficient (R) of 0.079 and weighted average of 3.16, a difference of 2.2%.
Average Family Size Correlation Summary
| Measurement | German | Tlingit-Haida |
| Minimum | 1.78 | 1.95 |
| Maximum | 6.33 | 3.84 |
| Range | 4.55 | 1.89 |
| Mean | 3.15 | 3.03 |
| Median | 3.02 | 3.13 |
| Interquartile 25% (IQ1) | 2.98 | 2.79 |
| Interquartile 75% (IQ3) | 3.18 | 3.29 |
| Interquartile Range (IQR) | 0.20 | 0.50 |
| Standard Deviation (Sample) | 0.54 | 0.44 |
| Standard Deviation (Population) | 0.54 | 0.43 |
Similar Demographics by Average Family Size
Demographics Similar to Germans by Average Family Size
In terms of average family size, the demographic groups most similar to Germans are Polish (3.09, a difference of 0.14%), Finnish (3.09, a difference of 0.19%), Norwegian (3.08, a difference of 0.23%), Croatian (3.10, a difference of 0.33%), and French (3.10, a difference of 0.34%).
| Demographics | Rating | Rank | Average Family Size |
| Estonians | 0.0 /100 | #333 | Tragic 3.10 |
| Lithuanians | 0.0 /100 | #334 | Tragic 3.10 |
| Luxembourgers | 0.0 /100 | #335 | Tragic 3.10 |
| Irish | 0.0 /100 | #336 | Tragic 3.10 |
| Swedes | 0.0 /100 | #337 | Tragic 3.10 |
| French | 0.0 /100 | #338 | Tragic 3.10 |
| Croatians | 0.0 /100 | #339 | Tragic 3.10 |
| Finns | 0.0 /100 | #340 | Tragic 3.09 |
| Poles | 0.0 /100 | #341 | Tragic 3.09 |
| Germans | 0.0 /100 | #342 | Tragic 3.09 |
| Norwegians | 0.0 /100 | #343 | Tragic 3.08 |
| French Canadians | 0.0 /100 | #344 | Tragic 3.07 |
| Slovenes | 0.0 /100 | #345 | Tragic 3.07 |
| Slovaks | 0.0 /100 | #346 | Tragic 3.06 |
| Carpatho Rusyns | 0.0 /100 | #347 | Tragic 3.06 |
Demographics Similar to Tlingit-Haida by Average Family Size
In terms of average family size, the demographic groups most similar to Tlingit-Haida are Immigrants from Germany (3.15, a difference of 0.020%), Immigrants from Singapore (3.16, a difference of 0.030%), Maltese (3.16, a difference of 0.040%), Immigrants from Lithuania (3.15, a difference of 0.040%), and New Zealander (3.15, a difference of 0.060%).
| Demographics | Rating | Rank | Average Family Size |
| Immigrants | Bulgaria | 1.0 /100 | #263 | Tragic 3.16 |
| Americans | 1.0 /100 | #264 | Tragic 3.16 |
| Immigrants | South Africa | 0.9 /100 | #265 | Tragic 3.16 |
| Immigrants | Greece | 0.9 /100 | #266 | Tragic 3.16 |
| Iroquois | 0.8 /100 | #267 | Tragic 3.16 |
| Maltese | 0.8 /100 | #268 | Tragic 3.16 |
| Immigrants | Singapore | 0.7 /100 | #269 | Tragic 3.16 |
| Tlingit-Haida | 0.7 /100 | #270 | Tragic 3.16 |
| Immigrants | Germany | 0.7 /100 | #271 | Tragic 3.15 |
| Immigrants | Lithuania | 0.6 /100 | #272 | Tragic 3.15 |
| New Zealanders | 0.6 /100 | #273 | Tragic 3.15 |
| Immigrants | Belgium | 0.6 /100 | #274 | Tragic 3.15 |
| Cambodians | 0.6 /100 | #275 | Tragic 3.15 |
| Immigrants | Bosnia and Herzegovina | 0.5 /100 | #276 | Tragic 3.15 |
| Swiss | 0.5 /100 | #277 | Tragic 3.15 |