Immigrants from West Indies vs White/Caucasian Average Family Size
COMPARE
Immigrants from West Indies
White/Caucasian
Average Family Size
Average Family Size Comparison
Immigrants from West Indies
Whites/Caucasians
3.33
AVERAGE FAMILY SIZE
99.9/ 100
METRIC RATING
71st/ 347
METRIC RANK
3.14
AVERAGE FAMILY SIZE
0.3/ 100
METRIC RATING
285th/ 347
METRIC RANK
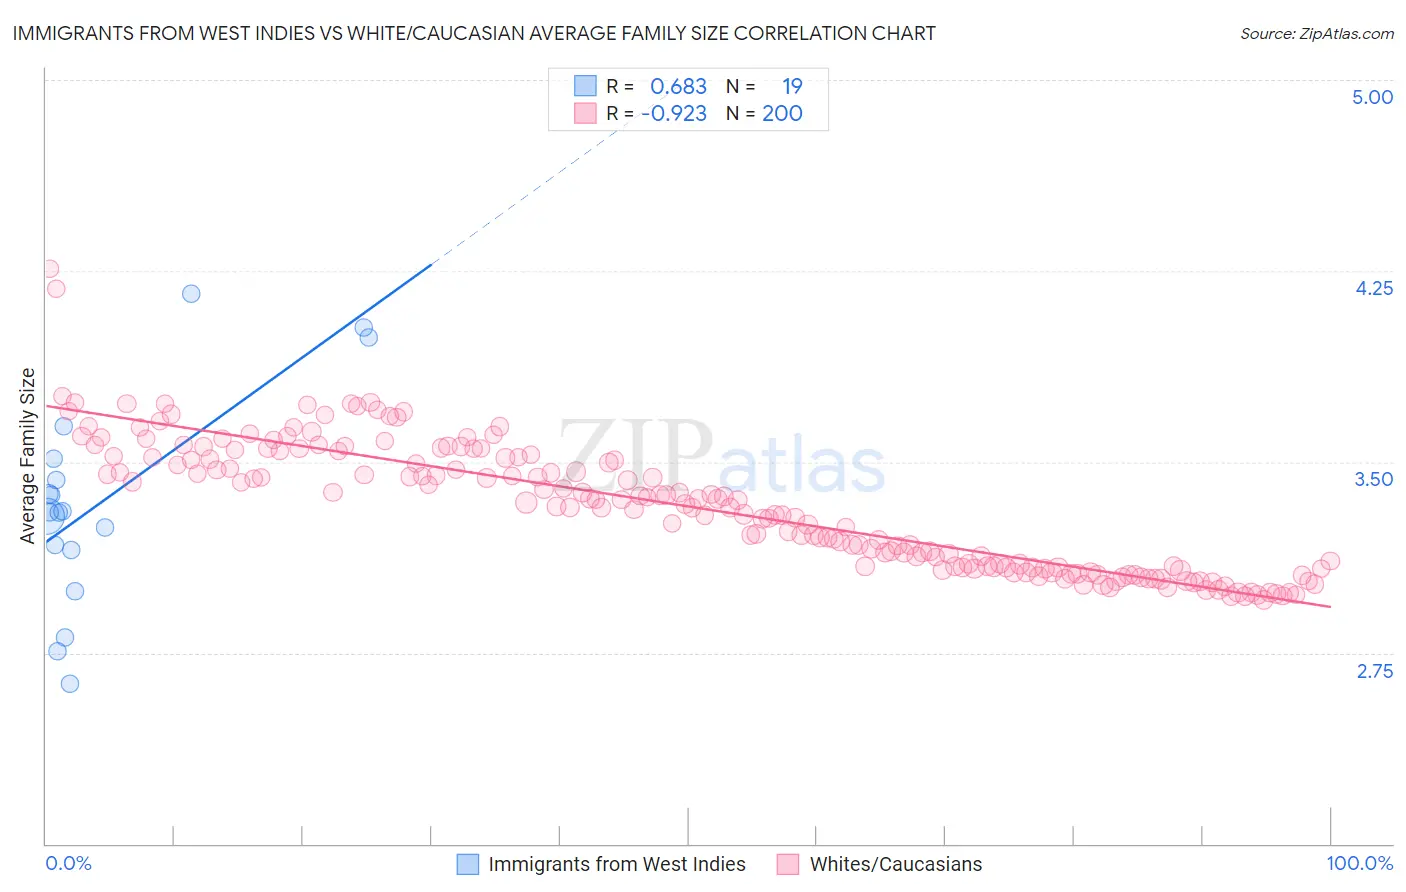
Immigrants from West Indies vs White/Caucasian Average Family Size Correlation Chart
The statistical analysis conducted on geographies consisting of 72,454,628 people shows a significant positive correlation between the proportion of Immigrants from West Indies and average family size in the United States with a correlation coefficient (R) of 0.683 and weighted average of 3.33. Similarly, the statistical analysis conducted on geographies consisting of 584,525,704 people shows a near-perfect negative correlation between the proportion of Whites/Caucasians and average family size in the United States with a correlation coefficient (R) of -0.923 and weighted average of 3.14, a difference of 5.9%.
Average Family Size Correlation Summary
| Measurement | Immigrants from West Indies | White/Caucasian |
| Minimum | 2.63 | 2.96 |
| Maximum | 4.16 | 4.26 |
| Range | 1.53 | 1.30 |
| Mean | 3.34 | 3.32 |
| Median | 3.30 | 3.33 |
| Interquartile 25% (IQ1) | 3.15 | 3.09 |
| Interquartile 75% (IQ3) | 3.51 | 3.52 |
| Interquartile Range (IQR) | 0.36 | 0.43 |
| Standard Deviation (Sample) | 0.41 | 0.25 |
| Standard Deviation (Population) | 0.40 | 0.25 |
Similar Demographics by Average Family Size
Demographics Similar to Immigrants from West Indies by Average Family Size
In terms of average family size, the demographic groups most similar to Immigrants from West Indies are Immigrants from Trinidad and Tobago (3.33, a difference of 0.010%), Immigrants (3.33, a difference of 0.060%), Immigrants from Caribbean (3.33, a difference of 0.070%), Immigrants from Cambodia (3.33, a difference of 0.090%), and Yaqui (3.32, a difference of 0.10%).
| Demographics | Rating | Rank | Average Family Size |
| Dominicans | 99.9 /100 | #64 | Exceptional 3.34 |
| Immigrants | Laos | 99.9 /100 | #65 | Exceptional 3.34 |
| Immigrants | St. Vincent and the Grenadines | 99.9 /100 | #66 | Exceptional 3.34 |
| Immigrants | Jamaica | 99.9 /100 | #67 | Exceptional 3.33 |
| Immigrants | Cambodia | 99.9 /100 | #68 | Exceptional 3.33 |
| Immigrants | Immigrants | 99.9 /100 | #69 | Exceptional 3.33 |
| Immigrants | Trinidad and Tobago | 99.9 /100 | #70 | Exceptional 3.33 |
| Immigrants | West Indies | 99.9 /100 | #71 | Exceptional 3.33 |
| Immigrants | Caribbean | 99.9 /100 | #72 | Exceptional 3.33 |
| Yaqui | 99.9 /100 | #73 | Exceptional 3.32 |
| Immigrants | Sierra Leone | 99.9 /100 | #74 | Exceptional 3.32 |
| Immigrants | Barbados | 99.8 /100 | #75 | Exceptional 3.32 |
| Trinidadians and Tobagonians | 99.8 /100 | #76 | Exceptional 3.32 |
| Immigrants | Ecuador | 99.8 /100 | #77 | Exceptional 3.32 |
| Immigrants | Micronesia | 99.8 /100 | #78 | Exceptional 3.32 |
Demographics Similar to Whites/Caucasians by Average Family Size
In terms of average family size, the demographic groups most similar to Whites/Caucasians are Immigrants from France (3.15, a difference of 0.050%), Immigrants from Netherlands (3.14, a difference of 0.050%), Greek (3.14, a difference of 0.060%), Immigrants from Czechoslovakia (3.14, a difference of 0.060%), and Immigrants from Norway (3.14, a difference of 0.060%).
| Demographics | Rating | Rank | Average Family Size |
| Okinawans | 0.5 /100 | #278 | Tragic 3.15 |
| Immigrants | Europe | 0.5 /100 | #279 | Tragic 3.15 |
| Immigrants | England | 0.4 /100 | #280 | Tragic 3.15 |
| Immigrants | Denmark | 0.4 /100 | #281 | Tragic 3.15 |
| Yugoslavians | 0.4 /100 | #282 | Tragic 3.15 |
| German Russians | 0.4 /100 | #283 | Tragic 3.15 |
| Immigrants | France | 0.4 /100 | #284 | Tragic 3.15 |
| Whites/Caucasians | 0.3 /100 | #285 | Tragic 3.14 |
| Immigrants | Netherlands | 0.3 /100 | #286 | Tragic 3.14 |
| Greeks | 0.3 /100 | #287 | Tragic 3.14 |
| Immigrants | Czechoslovakia | 0.3 /100 | #288 | Tragic 3.14 |
| Immigrants | Norway | 0.3 /100 | #289 | Tragic 3.14 |
| Cypriots | 0.3 /100 | #290 | Tragic 3.14 |
| Alsatians | 0.2 /100 | #291 | Tragic 3.14 |
| Europeans | 0.2 /100 | #292 | Tragic 3.14 |