Immigrants from Vietnam vs Macedonian Family Households with Children
COMPARE
Immigrants from Vietnam
Macedonian
Family Households with Children
Family Households with Children Comparison
Immigrants from Vietnam
Macedonians
29.5%
FAMILY HOUSEHOLDS WITH CHILDREN
100.0/ 100
METRIC RATING
27th/ 347
METRIC RANK
26.4%
FAMILY HOUSEHOLDS WITH CHILDREN
0.1/ 100
METRIC RATING
295th/ 347
METRIC RANK
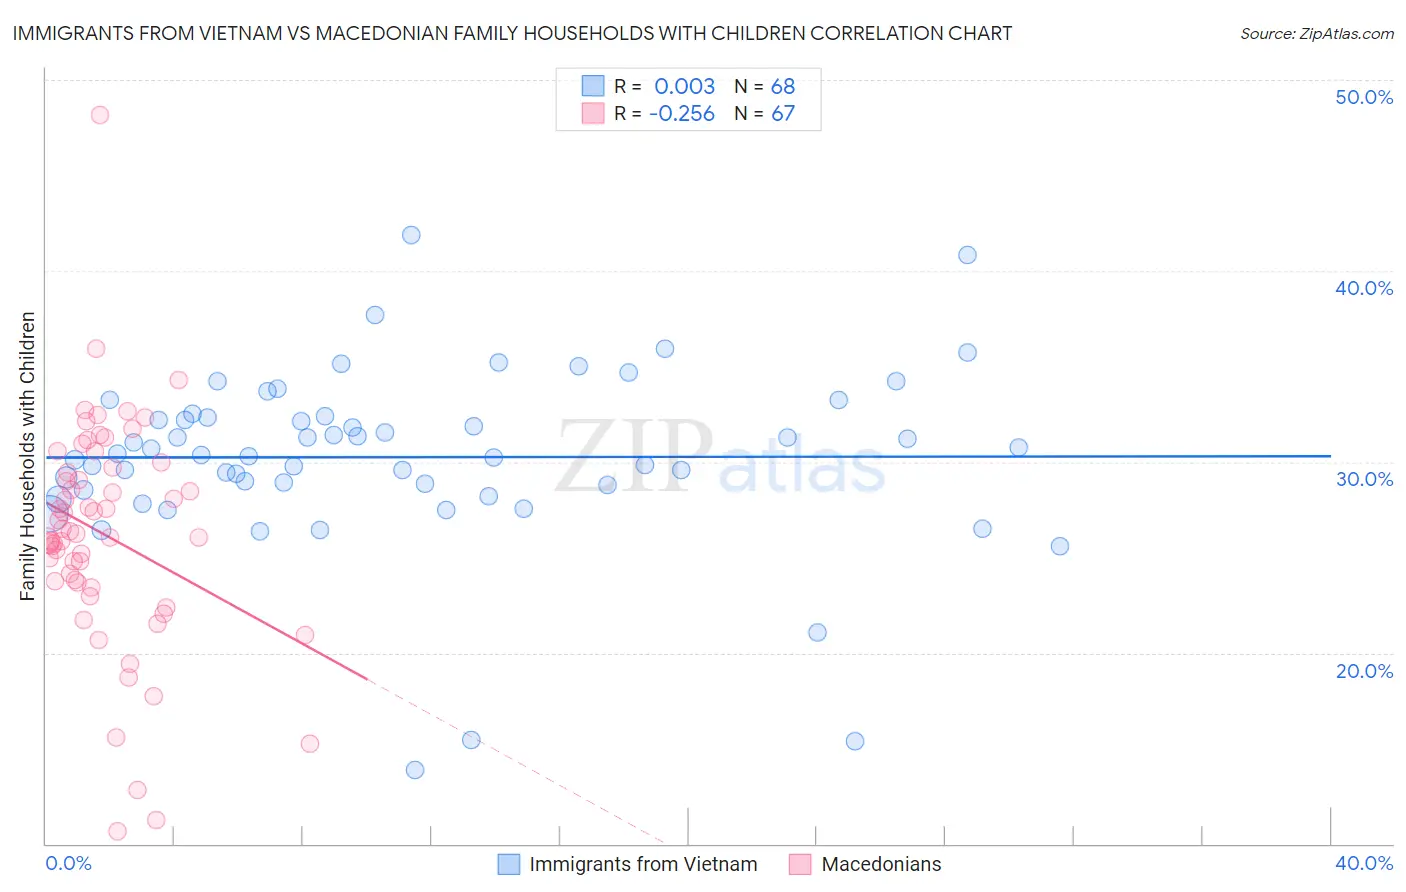
Immigrants from Vietnam vs Macedonian Family Households with Children Correlation Chart
The statistical analysis conducted on geographies consisting of 404,427,903 people shows no correlation between the proportion of Immigrants from Vietnam and percentage of family households with children in the United States with a correlation coefficient (R) of 0.003 and weighted average of 29.5%. Similarly, the statistical analysis conducted on geographies consisting of 132,577,245 people shows a weak negative correlation between the proportion of Macedonians and percentage of family households with children in the United States with a correlation coefficient (R) of -0.256 and weighted average of 26.4%, a difference of 11.8%.
Family Households with Children Correlation Summary
| Measurement | Immigrants from Vietnam | Macedonian |
| Minimum | 13.9% | 10.7% |
| Maximum | 41.9% | 48.2% |
| Range | 28.0% | 37.5% |
| Mean | 30.2% | 26.2% |
| Median | 30.4% | 26.2% |
| Interquartile 25% (IQ1) | 28.7% | 23.7% |
| Interquartile 75% (IQ3) | 32.4% | 29.7% |
| Interquartile Range (IQR) | 3.7% | 6.0% |
| Standard Deviation (Sample) | 4.7% | 5.9% |
| Standard Deviation (Population) | 4.7% | 5.9% |
Similar Demographics by Family Households with Children
Demographics Similar to Immigrants from Vietnam by Family Households with Children
In terms of family households with children, the demographic groups most similar to Immigrants from Vietnam are Sri Lankan (29.5%, a difference of 0.030%), Samoan (29.5%, a difference of 0.16%), Bolivian (29.5%, a difference of 0.16%), Yuman (29.5%, a difference of 0.19%), and Japanese (29.4%, a difference of 0.34%).
| Demographics | Rating | Rank | Family Households with Children |
| Immigrants | El Salvador | 100.0 /100 | #20 | Exceptional 29.8% |
| Immigrants | Laos | 100.0 /100 | #21 | Exceptional 29.8% |
| Malaysians | 100.0 /100 | #22 | Exceptional 29.8% |
| Mexican American Indians | 100.0 /100 | #23 | Exceptional 29.7% |
| Guamanians/Chamorros | 100.0 /100 | #24 | Exceptional 29.7% |
| Immigrants | Latin America | 100.0 /100 | #25 | Exceptional 29.7% |
| Sri Lankans | 100.0 /100 | #26 | Exceptional 29.5% |
| Immigrants | Vietnam | 100.0 /100 | #27 | Exceptional 29.5% |
| Samoans | 100.0 /100 | #28 | Exceptional 29.5% |
| Bolivians | 100.0 /100 | #29 | Exceptional 29.5% |
| Yuman | 100.0 /100 | #30 | Exceptional 29.5% |
| Japanese | 100.0 /100 | #31 | Exceptional 29.4% |
| Immigrants | Yemen | 100.0 /100 | #32 | Exceptional 29.4% |
| Venezuelans | 100.0 /100 | #33 | Exceptional 29.4% |
| Immigrants | Bolivia | 100.0 /100 | #34 | Exceptional 29.3% |
Demographics Similar to Macedonians by Family Households with Children
In terms of family households with children, the demographic groups most similar to Macedonians are Croatian (26.4%, a difference of 0.020%), Armenian (26.4%, a difference of 0.030%), Latvian (26.4%, a difference of 0.080%), Black/African American (26.5%, a difference of 0.13%), and Immigrants from Western Europe (26.4%, a difference of 0.13%).
| Demographics | Rating | Rank | Family Households with Children |
| Russians | 0.2 /100 | #288 | Tragic 26.5% |
| Immigrants | Sweden | 0.2 /100 | #289 | Tragic 26.5% |
| Albanians | 0.2 /100 | #290 | Tragic 26.5% |
| Bahamians | 0.2 /100 | #291 | Tragic 26.5% |
| Poles | 0.2 /100 | #292 | Tragic 26.5% |
| Blacks/African Americans | 0.1 /100 | #293 | Tragic 26.5% |
| Latvians | 0.1 /100 | #294 | Tragic 26.4% |
| Macedonians | 0.1 /100 | #295 | Tragic 26.4% |
| Croatians | 0.1 /100 | #296 | Tragic 26.4% |
| Armenians | 0.1 /100 | #297 | Tragic 26.4% |
| Immigrants | Western Europe | 0.1 /100 | #298 | Tragic 26.4% |
| Trinidadians and Tobagonians | 0.1 /100 | #299 | Tragic 26.4% |
| Paiute | 0.1 /100 | #300 | Tragic 26.4% |
| Immigrants | Trinidad and Tobago | 0.1 /100 | #301 | Tragic 26.4% |
| Serbians | 0.1 /100 | #302 | Tragic 26.4% |