Immigrants from Vietnam vs Immigrants from Central America Family Households with Children
COMPARE
Immigrants from Vietnam
Immigrants from Central America
Family Households with Children
Family Households with Children Comparison
Immigrants from Vietnam
Immigrants from Central America
29.5%
FAMILY HOUSEHOLDS WITH CHILDREN
100.0/ 100
METRIC RATING
27th/ 347
METRIC RANK
31.0%
FAMILY HOUSEHOLDS WITH CHILDREN
100.0/ 100
METRIC RATING
7th/ 347
METRIC RANK
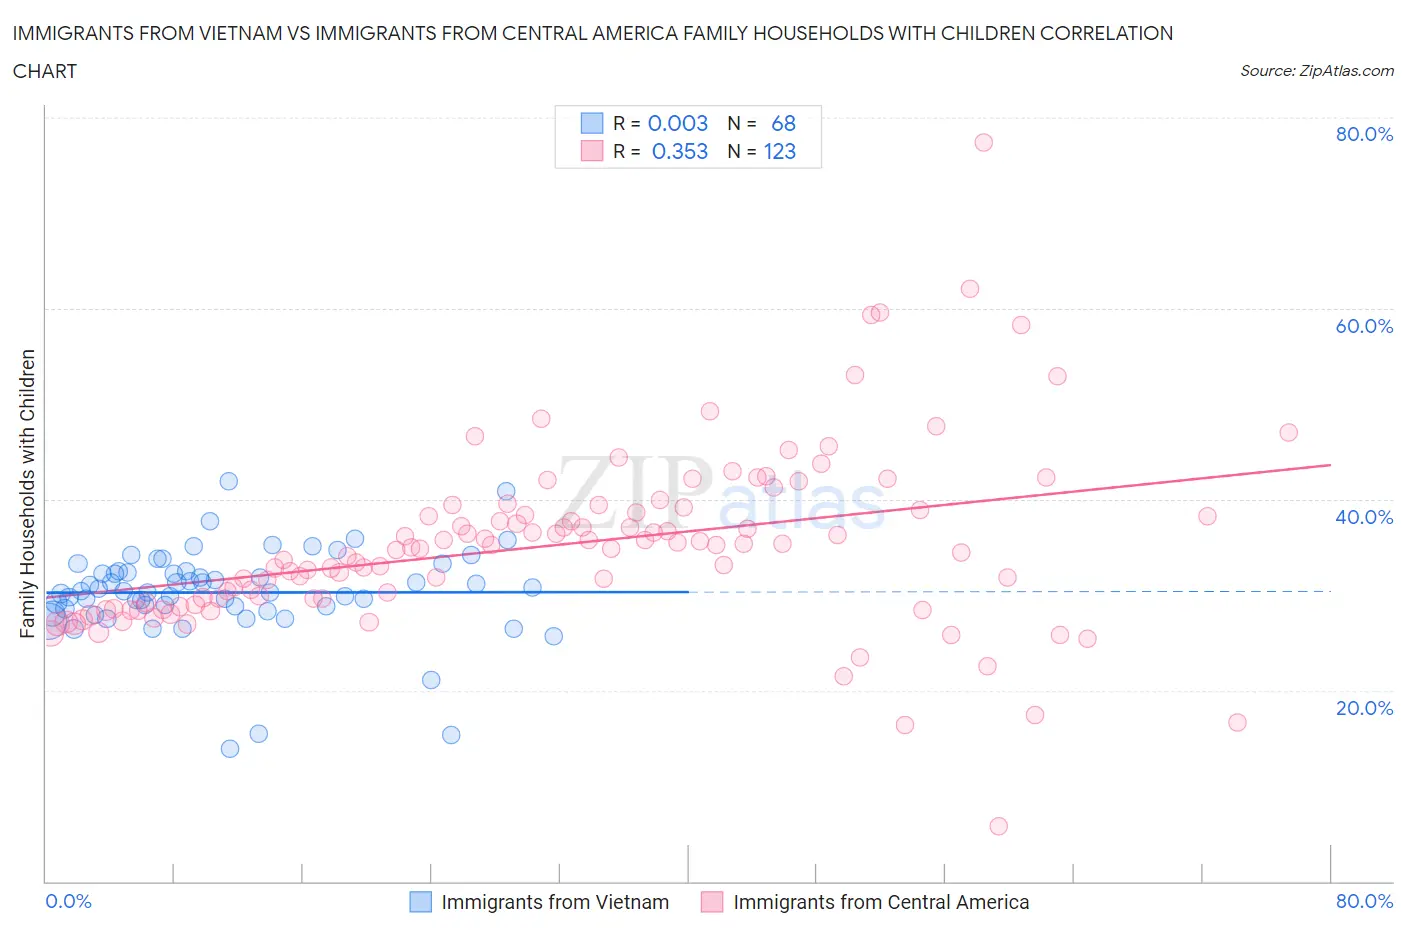
Immigrants from Vietnam vs Immigrants from Central America Family Households with Children Correlation Chart
The statistical analysis conducted on geographies consisting of 404,427,903 people shows no correlation between the proportion of Immigrants from Vietnam and percentage of family households with children in the United States with a correlation coefficient (R) of 0.003 and weighted average of 29.5%. Similarly, the statistical analysis conducted on geographies consisting of 535,819,231 people shows a mild positive correlation between the proportion of Immigrants from Central America and percentage of family households with children in the United States with a correlation coefficient (R) of 0.353 and weighted average of 31.0%, a difference of 4.8%.
Family Households with Children Correlation Summary
| Measurement | Immigrants from Vietnam | Immigrants from Central America |
| Minimum | 13.9% | 5.8% |
| Maximum | 41.9% | 77.4% |
| Range | 28.0% | 71.6% |
| Mean | 30.2% | 35.2% |
| Median | 30.4% | 34.8% |
| Interquartile 25% (IQ1) | 28.7% | 29.0% |
| Interquartile 75% (IQ3) | 32.4% | 38.9% |
| Interquartile Range (IQR) | 3.7% | 9.9% |
| Standard Deviation (Sample) | 4.7% | 9.4% |
| Standard Deviation (Population) | 4.7% | 9.4% |
Demographics Similar to Immigrants from Vietnam and Immigrants from Central America by Family Households with Children
In terms of family households with children, the demographic groups most similar to Immigrants from Vietnam are Sri Lankan (29.5%, a difference of 0.030%), Immigrants from Latin America (29.7%, a difference of 0.47%), Guamanian/Chamorro (29.7%, a difference of 0.57%), Mexican American Indian (29.7%, a difference of 0.67%), and Malaysian (29.8%, a difference of 0.94%). Similarly, the demographic groups most similar to Immigrants from Central America are Yakama (30.8%, a difference of 0.57%), Thai (30.6%, a difference of 1.1%), Immigrants from Fiji (30.5%, a difference of 1.4%), Nepalese (30.5%, a difference of 1.5%), and Immigrants from Pakistan (30.2%, a difference of 2.3%).
| Demographics | Rating | Rank | Family Households with Children |
| Immigrants | Central America | 100.0 /100 | #7 | Exceptional 31.0% |
| Yakama | 100.0 /100 | #8 | Exceptional 30.8% |
| Thais | 100.0 /100 | #9 | Exceptional 30.6% |
| Immigrants | Fiji | 100.0 /100 | #10 | Exceptional 30.5% |
| Nepalese | 100.0 /100 | #11 | Exceptional 30.5% |
| Immigrants | Pakistan | 100.0 /100 | #12 | Exceptional 30.2% |
| Afghans | 100.0 /100 | #13 | Exceptional 30.2% |
| Bangladeshis | 100.0 /100 | #14 | Exceptional 30.1% |
| Immigrants | South Central Asia | 100.0 /100 | #15 | Exceptional 30.0% |
| Immigrants | Afghanistan | 100.0 /100 | #16 | Exceptional 30.0% |
| Hispanics or Latinos | 100.0 /100 | #17 | Exceptional 29.9% |
| Salvadorans | 100.0 /100 | #18 | Exceptional 29.9% |
| Alaska Natives | 100.0 /100 | #19 | Exceptional 29.9% |
| Immigrants | El Salvador | 100.0 /100 | #20 | Exceptional 29.8% |
| Immigrants | Laos | 100.0 /100 | #21 | Exceptional 29.8% |
| Malaysians | 100.0 /100 | #22 | Exceptional 29.8% |
| Mexican American Indians | 100.0 /100 | #23 | Exceptional 29.7% |
| Guamanians/Chamorros | 100.0 /100 | #24 | Exceptional 29.7% |
| Immigrants | Latin America | 100.0 /100 | #25 | Exceptional 29.7% |
| Sri Lankans | 100.0 /100 | #26 | Exceptional 29.5% |
| Immigrants | Vietnam | 100.0 /100 | #27 | Exceptional 29.5% |