Immigrants from Norway vs Macedonian Family Households with Children
COMPARE
Immigrants from Norway
Macedonian
Family Households with Children
Family Households with Children Comparison
Immigrants from Norway
Macedonians
26.1%
FAMILY HOUSEHOLDS WITH CHILDREN
0.0/ 100
METRIC RATING
315th/ 347
METRIC RANK
26.4%
FAMILY HOUSEHOLDS WITH CHILDREN
0.1/ 100
METRIC RATING
295th/ 347
METRIC RANK
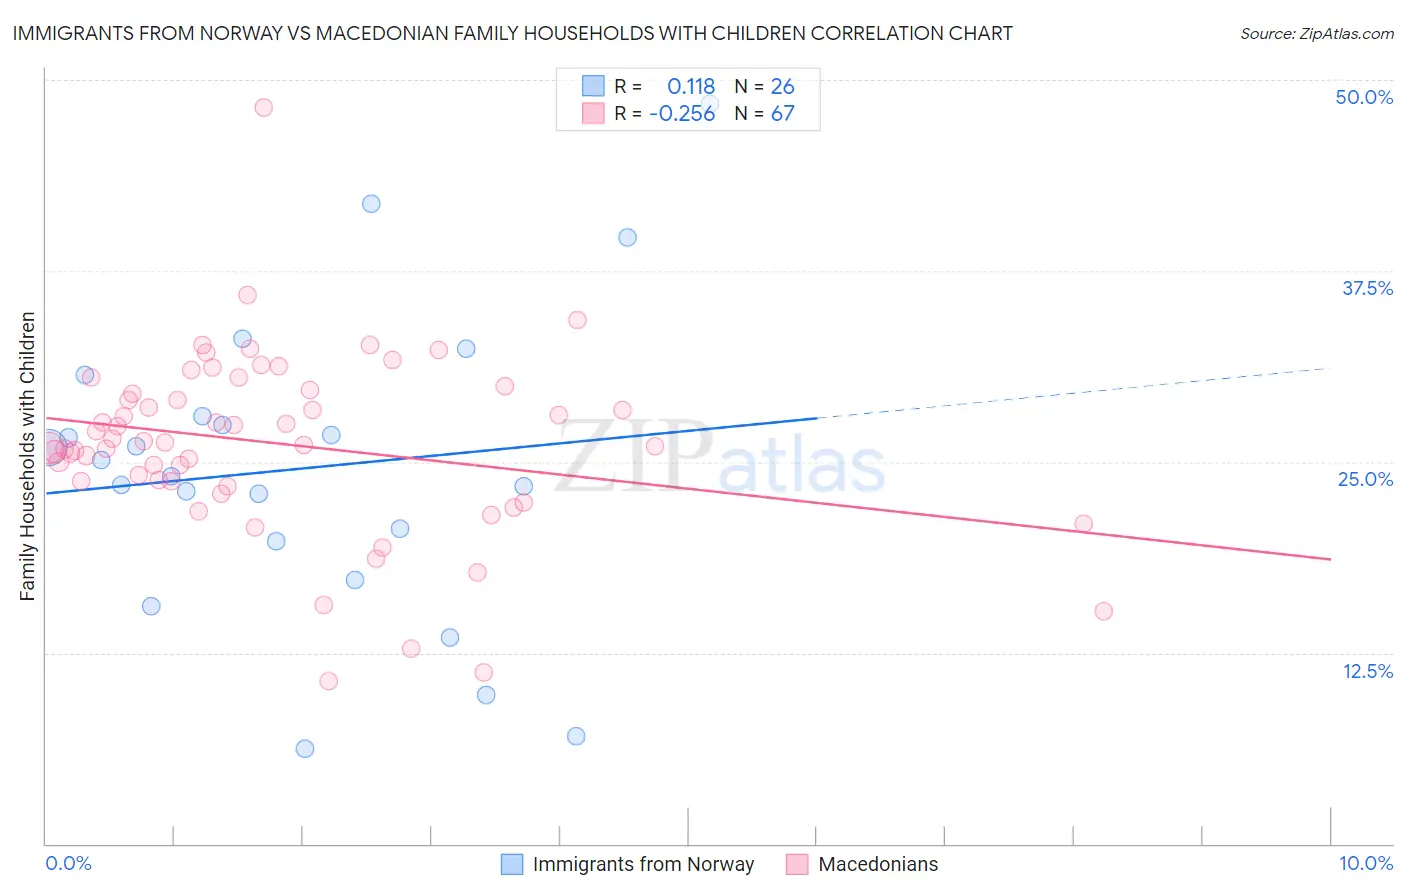
Immigrants from Norway vs Macedonian Family Households with Children Correlation Chart
The statistical analysis conducted on geographies consisting of 116,684,213 people shows a poor positive correlation between the proportion of Immigrants from Norway and percentage of family households with children in the United States with a correlation coefficient (R) of 0.118 and weighted average of 26.1%. Similarly, the statistical analysis conducted on geographies consisting of 132,577,245 people shows a weak negative correlation between the proportion of Macedonians and percentage of family households with children in the United States with a correlation coefficient (R) of -0.256 and weighted average of 26.4%, a difference of 1.2%.
Family Households with Children Correlation Summary
| Measurement | Immigrants from Norway | Macedonian |
| Minimum | 6.2% | 10.7% |
| Maximum | 48.4% | 48.2% |
| Range | 42.2% | 37.5% |
| Mean | 24.6% | 26.2% |
| Median | 24.6% | 26.2% |
| Interquartile 25% (IQ1) | 19.8% | 23.7% |
| Interquartile 75% (IQ3) | 28.0% | 29.7% |
| Interquartile Range (IQR) | 8.1% | 6.0% |
| Standard Deviation (Sample) | 9.9% | 5.9% |
| Standard Deviation (Population) | 9.7% | 5.9% |
Demographics Similar to Immigrants from Norway and Macedonians by Family Households with Children
In terms of family households with children, the demographic groups most similar to Immigrants from Norway are French Canadian (26.1%, a difference of 0.070%), Cree (26.2%, a difference of 0.15%), Immigrants from Czechoslovakia (26.2%, a difference of 0.41%), Colville (26.2%, a difference of 0.48%), and Marshallese (26.2%, a difference of 0.52%). Similarly, the demographic groups most similar to Macedonians are Croatian (26.4%, a difference of 0.020%), Armenian (26.4%, a difference of 0.030%), Immigrants from Western Europe (26.4%, a difference of 0.13%), Trinidadian and Tobagonian (26.4%, a difference of 0.14%), and Paiute (26.4%, a difference of 0.26%).
| Demographics | Rating | Rank | Family Households with Children |
| Macedonians | 0.1 /100 | #295 | Tragic 26.4% |
| Croatians | 0.1 /100 | #296 | Tragic 26.4% |
| Armenians | 0.1 /100 | #297 | Tragic 26.4% |
| Immigrants | Western Europe | 0.1 /100 | #298 | Tragic 26.4% |
| Trinidadians and Tobagonians | 0.1 /100 | #299 | Tragic 26.4% |
| Paiute | 0.1 /100 | #300 | Tragic 26.4% |
| Immigrants | Trinidad and Tobago | 0.1 /100 | #301 | Tragic 26.4% |
| Serbians | 0.1 /100 | #302 | Tragic 26.4% |
| Immigrants | Guyana | 0.1 /100 | #303 | Tragic 26.3% |
| Immigrants | Bahamas | 0.1 /100 | #304 | Tragic 26.3% |
| Guyanese | 0.1 /100 | #305 | Tragic 26.3% |
| Bermudans | 0.1 /100 | #306 | Tragic 26.3% |
| West Indians | 0.0 /100 | #307 | Tragic 26.3% |
| Lumbee | 0.0 /100 | #308 | Tragic 26.3% |
| Immigrants | Somalia | 0.0 /100 | #309 | Tragic 26.3% |
| Marshallese | 0.0 /100 | #310 | Tragic 26.2% |
| Colville | 0.0 /100 | #311 | Tragic 26.2% |
| Immigrants | Czechoslovakia | 0.0 /100 | #312 | Tragic 26.2% |
| Cree | 0.0 /100 | #313 | Tragic 26.2% |
| French Canadians | 0.0 /100 | #314 | Tragic 26.1% |
| Immigrants | Norway | 0.0 /100 | #315 | Tragic 26.1% |