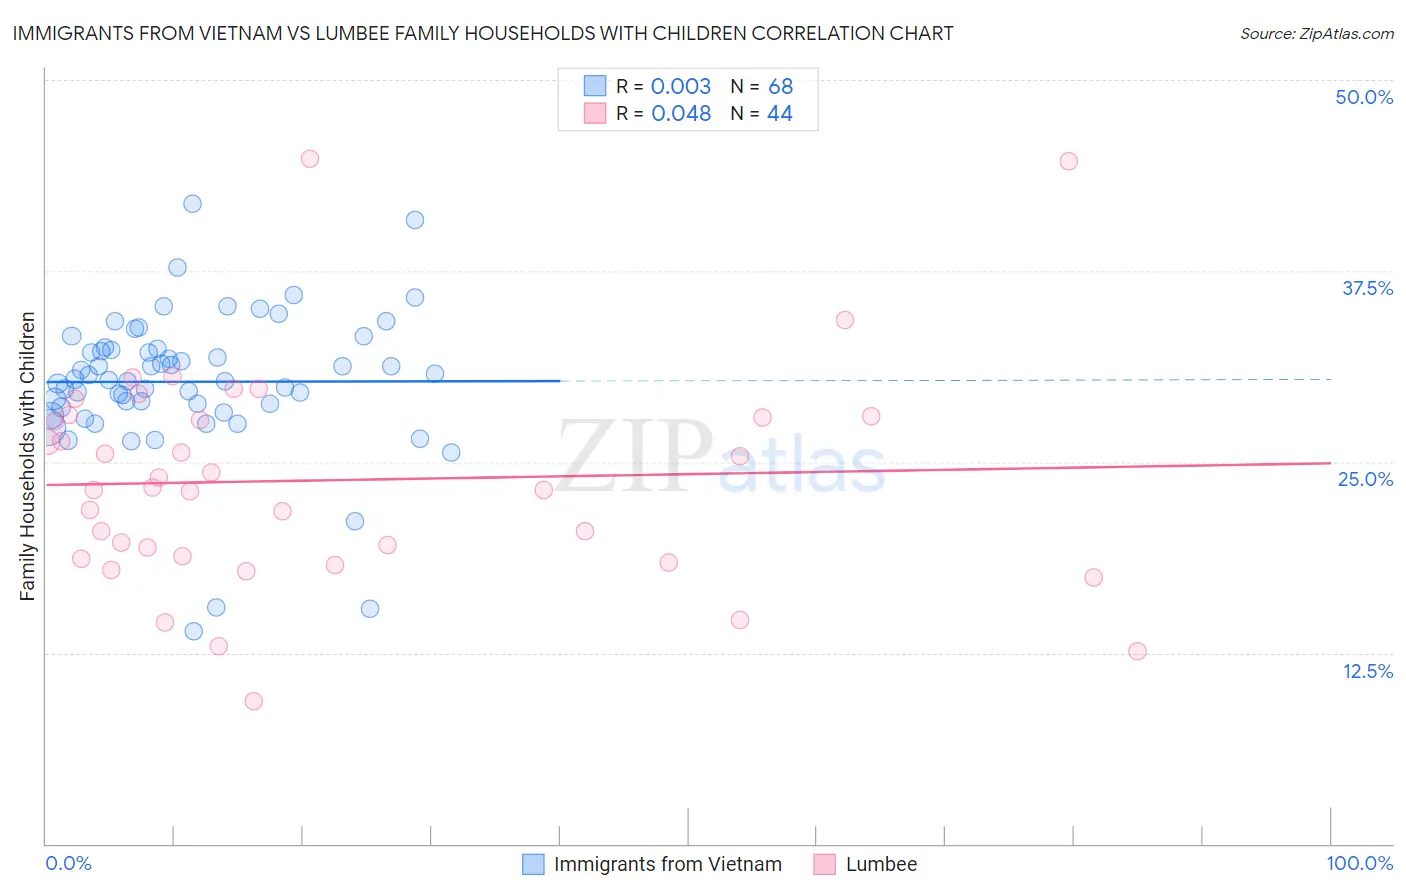
Immigrants from Vietnam vs Lumbee Family Households with Children
COMPARE
Immigrants from Vietnam
Lumbee
Family Households with Children
Family Households with Children Comparison
Immigrants from Vietnam
Lumbee
29.5%
FAMILY HOUSEHOLDS WITH CHILDREN
100.0/ 100
METRIC RATING
27th/ 347
METRIC RANK
26.3%
FAMILY HOUSEHOLDS WITH CHILDREN
0.0/ 100
METRIC RATING
308th/ 347
METRIC RANK
Immigrants from Vietnam vs Lumbee Family Households with Children Correlation Chart
The statistical analysis conducted on geographies consisting of 404,427,903 people shows no correlation between the proportion of Immigrants from Vietnam and percentage of family households with children in the United States with a correlation coefficient (R) of 0.003 and weighted average of 29.5%. Similarly, the statistical analysis conducted on geographies consisting of 92,262,389 people shows no correlation between the proportion of Lumbee and percentage of family households with children in the United States with a correlation coefficient (R) of 0.048 and weighted average of 26.3%, a difference of 12.4%.
Family Households with Children Correlation Summary
| Measurement | Immigrants from Vietnam | Lumbee |
| Minimum | 13.9% | 9.3% |
| Maximum | 41.9% | 44.9% |
| Range | 28.0% | 35.5% |
| Mean | 30.2% | 23.8% |
| Median | 30.4% | 23.2% |
| Interquartile 25% (IQ1) | 28.7% | 18.7% |
| Interquartile 75% (IQ3) | 32.4% | 27.9% |
| Interquartile Range (IQR) | 3.7% | 9.2% |
| Standard Deviation (Sample) | 4.7% | 7.2% |
| Standard Deviation (Population) | 4.7% | 7.1% |
Similar Demographics by Family Households with Children
Demographics Similar to Immigrants from Vietnam by Family Households with Children
In terms of family households with children, the demographic groups most similar to Immigrants from Vietnam are Sri Lankan (29.5%, a difference of 0.030%), Samoan (29.5%, a difference of 0.16%), Bolivian (29.5%, a difference of 0.16%), Yuman (29.5%, a difference of 0.19%), and Japanese (29.4%, a difference of 0.34%).
| Demographics | Rating | Rank | Family Households with Children |
| Immigrants | El Salvador | 100.0 /100 | #20 | Exceptional 29.8% |
| Immigrants | Laos | 100.0 /100 | #21 | Exceptional 29.8% |
| Malaysians | 100.0 /100 | #22 | Exceptional 29.8% |
| Mexican American Indians | 100.0 /100 | #23 | Exceptional 29.7% |
| Guamanians/Chamorros | 100.0 /100 | #24 | Exceptional 29.7% |
| Immigrants | Latin America | 100.0 /100 | #25 | Exceptional 29.7% |
| Sri Lankans | 100.0 /100 | #26 | Exceptional 29.5% |
| Immigrants | Vietnam | 100.0 /100 | #27 | Exceptional 29.5% |
| Samoans | 100.0 /100 | #28 | Exceptional 29.5% |
| Bolivians | 100.0 /100 | #29 | Exceptional 29.5% |
| Yuman | 100.0 /100 | #30 | Exceptional 29.5% |
| Japanese | 100.0 /100 | #31 | Exceptional 29.4% |
| Immigrants | Yemen | 100.0 /100 | #32 | Exceptional 29.4% |
| Venezuelans | 100.0 /100 | #33 | Exceptional 29.4% |
| Immigrants | Bolivia | 100.0 /100 | #34 | Exceptional 29.3% |
Demographics Similar to Lumbee by Family Households with Children
In terms of family households with children, the demographic groups most similar to Lumbee are West Indian (26.3%, a difference of 0.020%), Bermudan (26.3%, a difference of 0.10%), Immigrants from Somalia (26.3%, a difference of 0.11%), Guyanese (26.3%, a difference of 0.12%), and Immigrants from Bahamas (26.3%, a difference of 0.14%).
| Demographics | Rating | Rank | Family Households with Children |
| Immigrants | Trinidad and Tobago | 0.1 /100 | #301 | Tragic 26.4% |
| Serbians | 0.1 /100 | #302 | Tragic 26.4% |
| Immigrants | Guyana | 0.1 /100 | #303 | Tragic 26.3% |
| Immigrants | Bahamas | 0.1 /100 | #304 | Tragic 26.3% |
| Guyanese | 0.1 /100 | #305 | Tragic 26.3% |
| Bermudans | 0.1 /100 | #306 | Tragic 26.3% |
| West Indians | 0.0 /100 | #307 | Tragic 26.3% |
| Lumbee | 0.0 /100 | #308 | Tragic 26.3% |
| Immigrants | Somalia | 0.0 /100 | #309 | Tragic 26.3% |
| Marshallese | 0.0 /100 | #310 | Tragic 26.2% |
| Colville | 0.0 /100 | #311 | Tragic 26.2% |
| Immigrants | Czechoslovakia | 0.0 /100 | #312 | Tragic 26.2% |
| Cree | 0.0 /100 | #313 | Tragic 26.2% |
| French Canadians | 0.0 /100 | #314 | Tragic 26.1% |
| Immigrants | Norway | 0.0 /100 | #315 | Tragic 26.1% |