Immigrants from Vietnam vs English Family Households with Children
COMPARE
Immigrants from Vietnam
English
Family Households with Children
Family Households with Children Comparison
Immigrants from Vietnam
English
29.5%
FAMILY HOUSEHOLDS WITH CHILDREN
100.0/ 100
METRIC RATING
27th/ 347
METRIC RANK
27.3%
FAMILY HOUSEHOLDS WITH CHILDREN
32.0/ 100
METRIC RATING
199th/ 347
METRIC RANK
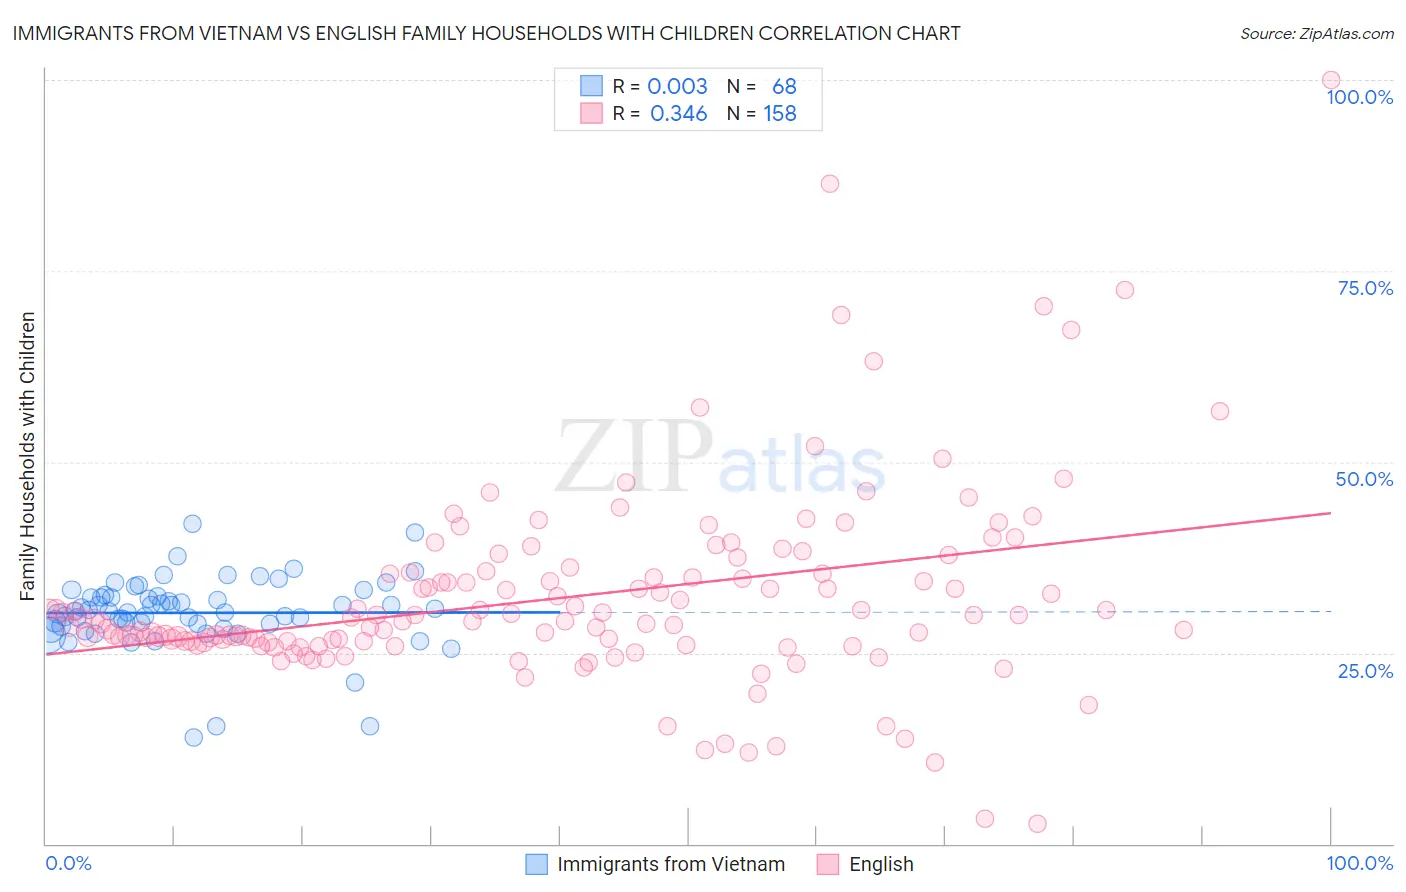
Immigrants from Vietnam vs English Family Households with Children Correlation Chart
The statistical analysis conducted on geographies consisting of 404,427,903 people shows no correlation between the proportion of Immigrants from Vietnam and percentage of family households with children in the United States with a correlation coefficient (R) of 0.003 and weighted average of 29.5%. Similarly, the statistical analysis conducted on geographies consisting of 578,706,985 people shows a mild positive correlation between the proportion of English and percentage of family households with children in the United States with a correlation coefficient (R) of 0.346 and weighted average of 27.3%, a difference of 8.1%.
Family Households with Children Correlation Summary
| Measurement | Immigrants from Vietnam | English |
| Minimum | 13.9% | 2.7% |
| Maximum | 41.9% | 100.0% |
| Range | 28.0% | 97.3% |
| Mean | 30.2% | 32.2% |
| Median | 30.4% | 29.2% |
| Interquartile 25% (IQ1) | 28.7% | 26.5% |
| Interquartile 75% (IQ3) | 32.4% | 35.4% |
| Interquartile Range (IQR) | 3.7% | 8.9% |
| Standard Deviation (Sample) | 4.7% | 12.9% |
| Standard Deviation (Population) | 4.7% | 12.9% |
Similar Demographics by Family Households with Children
Demographics Similar to Immigrants from Vietnam by Family Households with Children
In terms of family households with children, the demographic groups most similar to Immigrants from Vietnam are Sri Lankan (29.5%, a difference of 0.030%), Samoan (29.5%, a difference of 0.16%), Bolivian (29.5%, a difference of 0.16%), Yuman (29.5%, a difference of 0.19%), and Japanese (29.4%, a difference of 0.34%).
| Demographics | Rating | Rank | Family Households with Children |
| Immigrants | El Salvador | 100.0 /100 | #20 | Exceptional 29.8% |
| Immigrants | Laos | 100.0 /100 | #21 | Exceptional 29.8% |
| Malaysians | 100.0 /100 | #22 | Exceptional 29.8% |
| Mexican American Indians | 100.0 /100 | #23 | Exceptional 29.7% |
| Guamanians/Chamorros | 100.0 /100 | #24 | Exceptional 29.7% |
| Immigrants | Latin America | 100.0 /100 | #25 | Exceptional 29.7% |
| Sri Lankans | 100.0 /100 | #26 | Exceptional 29.5% |
| Immigrants | Vietnam | 100.0 /100 | #27 | Exceptional 29.5% |
| Samoans | 100.0 /100 | #28 | Exceptional 29.5% |
| Bolivians | 100.0 /100 | #29 | Exceptional 29.5% |
| Yuman | 100.0 /100 | #30 | Exceptional 29.5% |
| Japanese | 100.0 /100 | #31 | Exceptional 29.4% |
| Immigrants | Yemen | 100.0 /100 | #32 | Exceptional 29.4% |
| Venezuelans | 100.0 /100 | #33 | Exceptional 29.4% |
| Immigrants | Bolivia | 100.0 /100 | #34 | Exceptional 29.3% |
Demographics Similar to English by Family Households with Children
In terms of family households with children, the demographic groups most similar to English are Immigrants from Romania (27.4%, a difference of 0.060%), Norwegian (27.4%, a difference of 0.070%), Cheyenne (27.4%, a difference of 0.080%), Crow (27.4%, a difference of 0.090%), and Immigrants from Congo (27.3%, a difference of 0.090%).
| Demographics | Rating | Rank | Family Households with Children |
| Pennsylvania Germans | 37.5 /100 | #192 | Fair 27.4% |
| Swedes | 36.9 /100 | #193 | Fair 27.4% |
| Immigrants | Iran | 36.1 /100 | #194 | Fair 27.4% |
| Crow | 35.7 /100 | #195 | Fair 27.4% |
| Cheyenne | 35.1 /100 | #196 | Fair 27.4% |
| Norwegians | 35.0 /100 | #197 | Fair 27.4% |
| Immigrants | Romania | 34.4 /100 | #198 | Fair 27.4% |
| English | 32.0 /100 | #199 | Fair 27.3% |
| Immigrants | Congo | 28.7 /100 | #200 | Fair 27.3% |
| Bhutanese | 25.1 /100 | #201 | Fair 27.3% |
| Americans | 22.8 /100 | #202 | Fair 27.3% |
| Kiowa | 22.2 /100 | #203 | Fair 27.3% |
| Immigrants | Sudan | 21.6 /100 | #204 | Fair 27.3% |
| Immigrants | Haiti | 20.3 /100 | #205 | Fair 27.2% |
| Immigrants | Micronesia | 20.2 /100 | #206 | Fair 27.2% |