Kiowa vs Somali Single Mother Households
COMPARE
Kiowa
Somali
Single Mother Households
Single Mother Households Comparison
Kiowa
Somalis
7.1%
SINGLE MOTHER HOUSEHOLDS
0.8/ 100
METRIC RATING
239th/ 347
METRIC RANK
7.5%
SINGLE MOTHER HOUSEHOLDS
0.1/ 100
METRIC RATING
269th/ 347
METRIC RANK
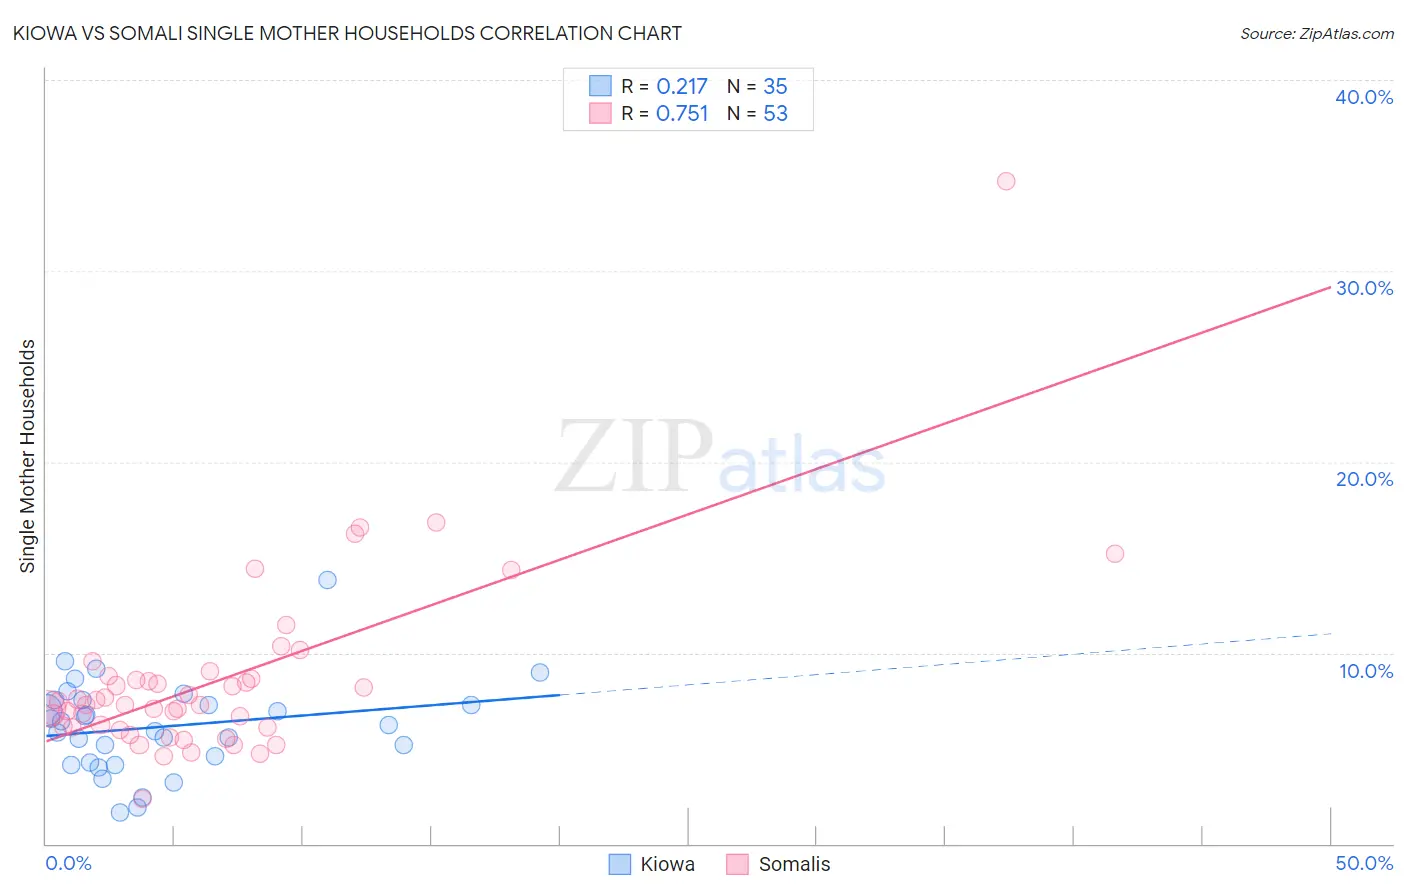
Kiowa vs Somali Single Mother Households Correlation Chart
The statistical analysis conducted on geographies consisting of 56,080,330 people shows a weak positive correlation between the proportion of Kiowa and percentage of single mother households in the United States with a correlation coefficient (R) of 0.217 and weighted average of 7.1%. Similarly, the statistical analysis conducted on geographies consisting of 99,265,723 people shows a strong positive correlation between the proportion of Somalis and percentage of single mother households in the United States with a correlation coefficient (R) of 0.751 and weighted average of 7.5%, a difference of 5.3%.
Single Mother Households Correlation Summary
| Measurement | Kiowa | Somali |
| Minimum | 1.7% | 2.4% |
| Maximum | 13.8% | 34.7% |
| Range | 12.2% | 32.3% |
| Mean | 6.1% | 8.6% |
| Median | 6.2% | 7.3% |
| Interquartile 25% (IQ1) | 4.2% | 6.1% |
| Interquartile 75% (IQ3) | 7.5% | 8.7% |
| Interquartile Range (IQR) | 3.3% | 2.6% |
| Standard Deviation (Sample) | 2.4% | 4.8% |
| Standard Deviation (Population) | 2.4% | 4.8% |
Similar Demographics by Single Mother Households
Demographics Similar to Kiowa by Single Mother Households
In terms of single mother households, the demographic groups most similar to Kiowa are Panamanian (7.1%, a difference of 0.27%), Immigrants from Panama (7.2%, a difference of 0.32%), Arapaho (7.1%, a difference of 0.41%), Ute (7.1%, a difference of 0.50%), and Immigrants from Portugal (7.2%, a difference of 0.67%).
| Demographics | Rating | Rank | Single Mother Households |
| Comanche | 1.5 /100 | #232 | Tragic 7.0% |
| Choctaw | 1.4 /100 | #233 | Tragic 7.0% |
| Chickasaw | 1.4 /100 | #234 | Tragic 7.0% |
| Immigrants | Burma/Myanmar | 1.4 /100 | #235 | Tragic 7.0% |
| Ute | 1.0 /100 | #236 | Tragic 7.1% |
| Arapaho | 1.0 /100 | #237 | Tragic 7.1% |
| Panamanians | 0.9 /100 | #238 | Tragic 7.1% |
| Kiowa | 0.8 /100 | #239 | Tragic 7.1% |
| Immigrants | Panama | 0.7 /100 | #240 | Tragic 7.2% |
| Immigrants | Portugal | 0.6 /100 | #241 | Tragic 7.2% |
| Fijians | 0.6 /100 | #242 | Tragic 7.2% |
| Ecuadorians | 0.6 /100 | #243 | Tragic 7.2% |
| Cubans | 0.6 /100 | #244 | Tragic 7.2% |
| Immigrants | Cambodia | 0.5 /100 | #245 | Tragic 7.2% |
| Nicaraguans | 0.5 /100 | #246 | Tragic 7.2% |
Demographics Similar to Somalis by Single Mother Households
In terms of single mother households, the demographic groups most similar to Somalis are Immigrants from Cuba (7.5%, a difference of 0.16%), Salvadoran (7.5%, a difference of 0.25%), Immigrants from the Azores (7.5%, a difference of 0.25%), Indonesian (7.5%, a difference of 0.41%), and Blackfeet (7.5%, a difference of 0.45%).
| Demographics | Rating | Rank | Single Mother Households |
| Immigrants | Somalia | 0.2 /100 | #262 | Tragic 7.4% |
| Immigrants | Nicaragua | 0.2 /100 | #263 | Tragic 7.4% |
| Yaqui | 0.1 /100 | #264 | Tragic 7.4% |
| Crow | 0.1 /100 | #265 | Tragic 7.4% |
| Nepalese | 0.1 /100 | #266 | Tragic 7.5% |
| Blackfeet | 0.1 /100 | #267 | Tragic 7.5% |
| Indonesians | 0.1 /100 | #268 | Tragic 7.5% |
| Somalis | 0.1 /100 | #269 | Tragic 7.5% |
| Immigrants | Cuba | 0.1 /100 | #270 | Tragic 7.5% |
| Salvadorans | 0.1 /100 | #271 | Tragic 7.5% |
| Immigrants | Azores | 0.1 /100 | #272 | Tragic 7.5% |
| Belizeans | 0.1 /100 | #273 | Tragic 7.6% |
| Immigrants | Guyana | 0.1 /100 | #274 | Tragic 7.6% |
| Central American Indians | 0.1 /100 | #275 | Tragic 7.6% |
| Guyanese | 0.1 /100 | #276 | Tragic 7.6% |