U.S. Virgin Islander vs Alaska Native Family Households
COMPARE
U.S. Virgin Islander
Alaska Native
Family Households
Family Households Comparison
U.S. Virgin Islanders
Alaska Natives
62.6%
FAMILY HOUSEHOLDS
0.0/ 100
METRIC RATING
291st/ 347
METRIC RANK
65.1%
FAMILY HOUSEHOLDS
97.3/ 100
METRIC RATING
107th/ 347
METRIC RANK
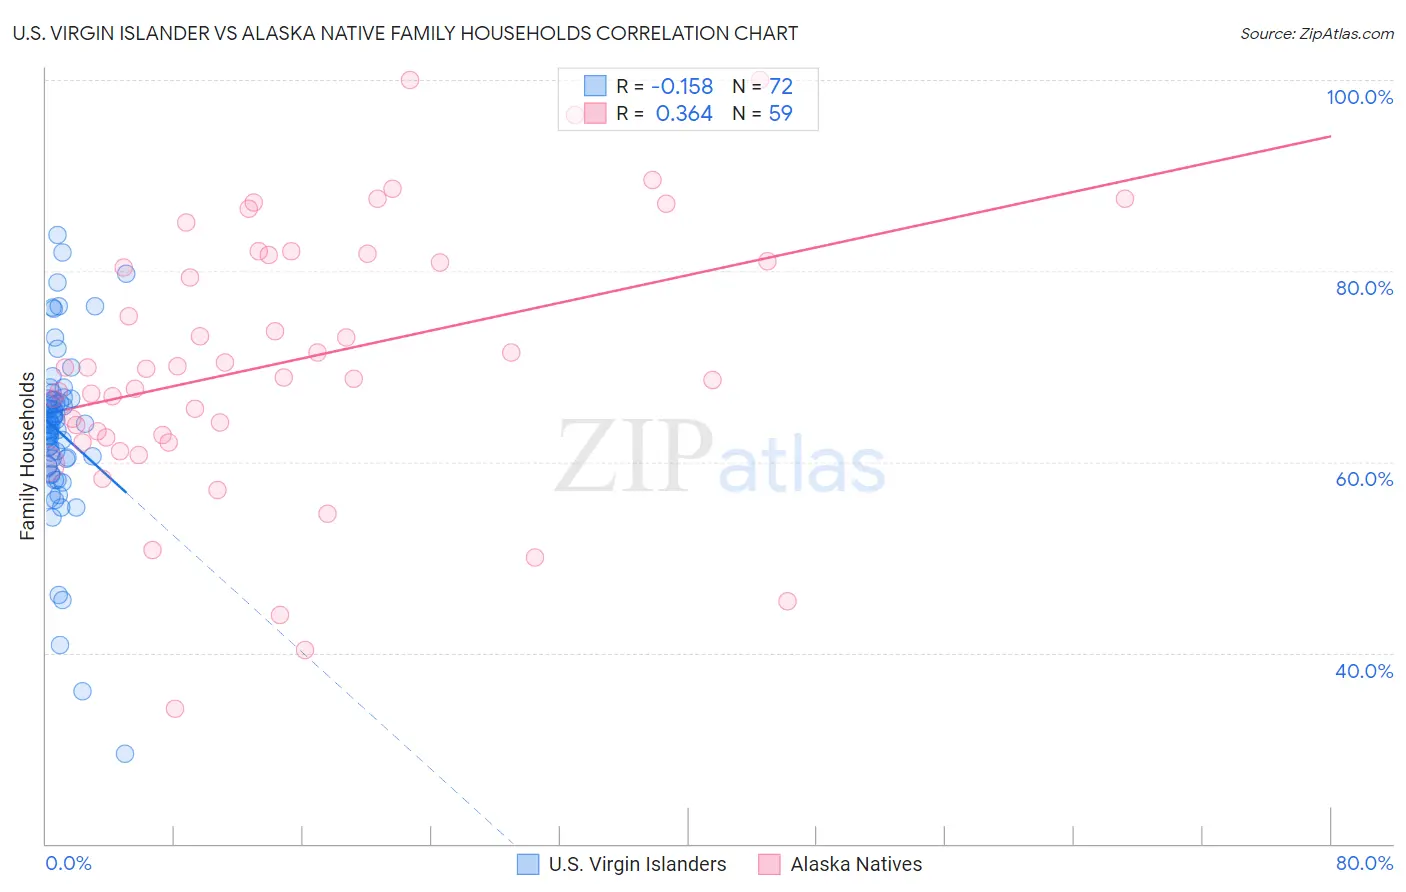
U.S. Virgin Islander vs Alaska Native Family Households Correlation Chart
The statistical analysis conducted on geographies consisting of 87,507,759 people shows a poor negative correlation between the proportion of U.S. Virgin Islanders and percentage of family households in the United States with a correlation coefficient (R) of -0.158 and weighted average of 62.6%. Similarly, the statistical analysis conducted on geographies consisting of 76,756,415 people shows a mild positive correlation between the proportion of Alaska Natives and percentage of family households in the United States with a correlation coefficient (R) of 0.364 and weighted average of 65.1%, a difference of 3.9%.
Family Households Correlation Summary
| Measurement | U.S. Virgin Islander | Alaska Native |
| Minimum | 29.5% | 34.1% |
| Maximum | 83.8% | 100.0% |
| Range | 54.3% | 65.9% |
| Mean | 63.2% | 70.5% |
| Median | 63.9% | 69.7% |
| Interquartile 25% (IQ1) | 59.9% | 62.6% |
| Interquartile 75% (IQ3) | 66.5% | 81.7% |
| Interquartile Range (IQR) | 6.6% | 19.1% |
| Standard Deviation (Sample) | 9.1% | 14.0% |
| Standard Deviation (Population) | 9.1% | 13.9% |
Similar Demographics by Family Households
Demographics Similar to U.S. Virgin Islanders by Family Households
In terms of family households, the demographic groups most similar to U.S. Virgin Islanders are Immigrants from Grenada (62.6%, a difference of 0.050%), Immigrants from Burma/Myanmar (62.6%, a difference of 0.050%), Immigrants from Nepal (62.7%, a difference of 0.13%), Immigrants from Sweden (62.5%, a difference of 0.18%), and Immigrants from Uganda (62.7%, a difference of 0.22%).
| Demographics | Rating | Rank | Family Households |
| Australians | 0.1 /100 | #284 | Tragic 62.8% |
| Mongolians | 0.1 /100 | #285 | Tragic 62.8% |
| British West Indians | 0.1 /100 | #286 | Tragic 62.8% |
| Latvians | 0.1 /100 | #287 | Tragic 62.8% |
| Immigrants | Uganda | 0.1 /100 | #288 | Tragic 62.7% |
| Immigrants | Nepal | 0.1 /100 | #289 | Tragic 62.7% |
| Immigrants | Grenada | 0.0 /100 | #290 | Tragic 62.6% |
| U.S. Virgin Islanders | 0.0 /100 | #291 | Tragic 62.6% |
| Immigrants | Burma/Myanmar | 0.0 /100 | #292 | Tragic 62.6% |
| Immigrants | Sweden | 0.0 /100 | #293 | Tragic 62.5% |
| Barbadians | 0.0 /100 | #294 | Tragic 62.5% |
| Okinawans | 0.0 /100 | #295 | Tragic 62.5% |
| Slovenes | 0.0 /100 | #296 | Tragic 62.4% |
| French American Indians | 0.0 /100 | #297 | Tragic 62.4% |
| Immigrants | Spain | 0.0 /100 | #298 | Tragic 62.4% |
Demographics Similar to Alaska Natives by Family Households
In terms of family households, the demographic groups most similar to Alaska Natives are White/Caucasian (65.1%, a difference of 0.0%), English (65.1%, a difference of 0.010%), Palestinian (65.1%, a difference of 0.010%), Immigrants from Guatemala (65.0%, a difference of 0.050%), and Scandinavian (65.0%, a difference of 0.060%).
| Demographics | Rating | Rank | Family Households |
| Haitians | 98.1 /100 | #100 | Exceptional 65.2% |
| Chileans | 98.1 /100 | #101 | Exceptional 65.2% |
| Immigrants | Sri Lanka | 98.0 /100 | #102 | Exceptional 65.1% |
| Indians (Asian) | 97.9 /100 | #103 | Exceptional 65.1% |
| Spaniards | 97.8 /100 | #104 | Exceptional 65.1% |
| English | 97.4 /100 | #105 | Exceptional 65.1% |
| Whites/Caucasians | 97.3 /100 | #106 | Exceptional 65.1% |
| Alaska Natives | 97.3 /100 | #107 | Exceptional 65.1% |
| Palestinians | 97.2 /100 | #108 | Exceptional 65.1% |
| Immigrants | Guatemala | 96.9 /100 | #109 | Exceptional 65.0% |
| Scandinavians | 96.8 /100 | #110 | Exceptional 65.0% |
| Europeans | 96.8 /100 | #111 | Exceptional 65.0% |
| Immigrants | Jordan | 96.5 /100 | #112 | Exceptional 65.0% |
| Spanish | 96.2 /100 | #113 | Exceptional 65.0% |
| Argentineans | 95.7 /100 | #114 | Exceptional 65.0% |