Immigrants from North Macedonia vs Pakistani Family Households
COMPARE
Immigrants from North Macedonia
Pakistani
Family Households
Family Households Comparison
Immigrants from North Macedonia
Pakistanis
64.7%
FAMILY HOUSEHOLDS
84.9/ 100
METRIC RATING
140th/ 347
METRIC RANK
64.7%
FAMILY HOUSEHOLDS
84.0/ 100
METRIC RATING
142nd/ 347
METRIC RANK
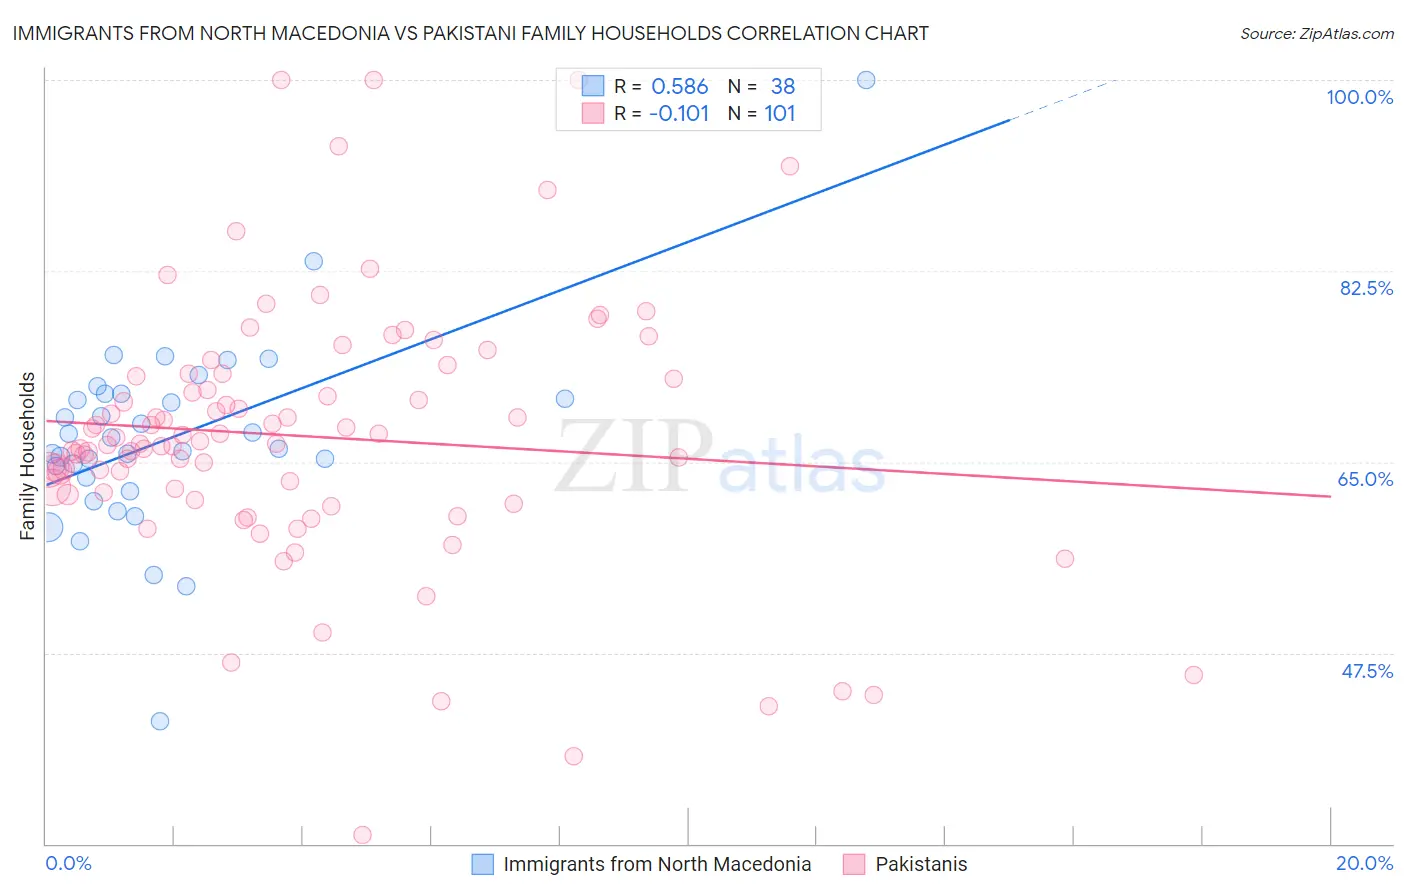
Immigrants from North Macedonia vs Pakistani Family Households Correlation Chart
The statistical analysis conducted on geographies consisting of 74,306,697 people shows a substantial positive correlation between the proportion of Immigrants from North Macedonia and percentage of family households in the United States with a correlation coefficient (R) of 0.586 and weighted average of 64.7%. Similarly, the statistical analysis conducted on geographies consisting of 335,180,363 people shows a poor negative correlation between the proportion of Pakistanis and percentage of family households in the United States with a correlation coefficient (R) of -0.101 and weighted average of 64.7%, a difference of 0.020%.
Family Households Correlation Summary
| Measurement | Immigrants from North Macedonia | Pakistani |
| Minimum | 41.2% | 30.8% |
| Maximum | 100.0% | 100.0% |
| Range | 58.8% | 69.2% |
| Mean | 67.2% | 67.3% |
| Median | 66.7% | 66.7% |
| Interquartile 25% (IQ1) | 63.5% | 62.1% |
| Interquartile 75% (IQ3) | 71.2% | 73.0% |
| Interquartile Range (IQR) | 7.7% | 10.9% |
| Standard Deviation (Sample) | 9.1% | 12.1% |
| Standard Deviation (Population) | 9.0% | 12.0% |
Demographics Similar to Immigrants from North Macedonia and Pakistanis by Family Households
In terms of family households, the demographic groups most similar to Immigrants from North Macedonia are Immigrants from Cameroon (64.7%, a difference of 0.0%), Immigrants from Jamaica (64.7%, a difference of 0.010%), Basque (64.7%, a difference of 0.020%), Immigrants from China (64.7%, a difference of 0.040%), and Immigrants from Scotland (64.7%, a difference of 0.040%). Similarly, the demographic groups most similar to Pakistanis are Immigrants from Cameroon (64.7%, a difference of 0.020%), Immigrants from Jamaica (64.7%, a difference of 0.030%), Basque (64.7%, a difference of 0.040%), Czechoslovakian (64.6%, a difference of 0.050%), and South American Indian (64.6%, a difference of 0.050%).
| Demographics | Rating | Rank | Family Households |
| Immigrants | Nonimmigrants | 90.1 /100 | #131 | Exceptional 64.8% |
| Cajuns | 89.4 /100 | #132 | Excellent 64.8% |
| Belizeans | 89.3 /100 | #133 | Excellent 64.8% |
| Greeks | 88.1 /100 | #134 | Excellent 64.7% |
| Maltese | 87.4 /100 | #135 | Excellent 64.7% |
| Immigrants | China | 86.6 /100 | #136 | Excellent 64.7% |
| Immigrants | Scotland | 86.4 /100 | #137 | Excellent 64.7% |
| Basques | 85.5 /100 | #138 | Excellent 64.7% |
| Immigrants | Jamaica | 85.3 /100 | #139 | Excellent 64.7% |
| Immigrants | North Macedonia | 84.9 /100 | #140 | Excellent 64.7% |
| Immigrants | Cameroon | 84.8 /100 | #141 | Excellent 64.7% |
| Pakistanis | 84.0 /100 | #142 | Excellent 64.7% |
| Czechoslovakians | 82.1 /100 | #143 | Excellent 64.6% |
| South American Indians | 81.9 /100 | #144 | Excellent 64.6% |
| Welsh | 80.1 /100 | #145 | Excellent 64.6% |
| Immigrants | Romania | 77.0 /100 | #146 | Good 64.6% |
| Immigrants | Chile | 76.5 /100 | #147 | Good 64.6% |
| Delaware | 76.3 /100 | #148 | Good 64.6% |
| Sioux | 76.3 /100 | #149 | Good 64.6% |
| Romanians | 75.3 /100 | #150 | Good 64.5% |
| Syrians | 75.2 /100 | #151 | Good 64.5% |