Immigrants from Hungary vs Pakistani Family Households
COMPARE
Immigrants from Hungary
Pakistani
Family Households
Family Households Comparison
Immigrants from Hungary
Pakistanis
63.6%
FAMILY HOUSEHOLDS
4.3/ 100
METRIC RATING
225th/ 347
METRIC RANK
64.7%
FAMILY HOUSEHOLDS
84.0/ 100
METRIC RATING
142nd/ 347
METRIC RANK
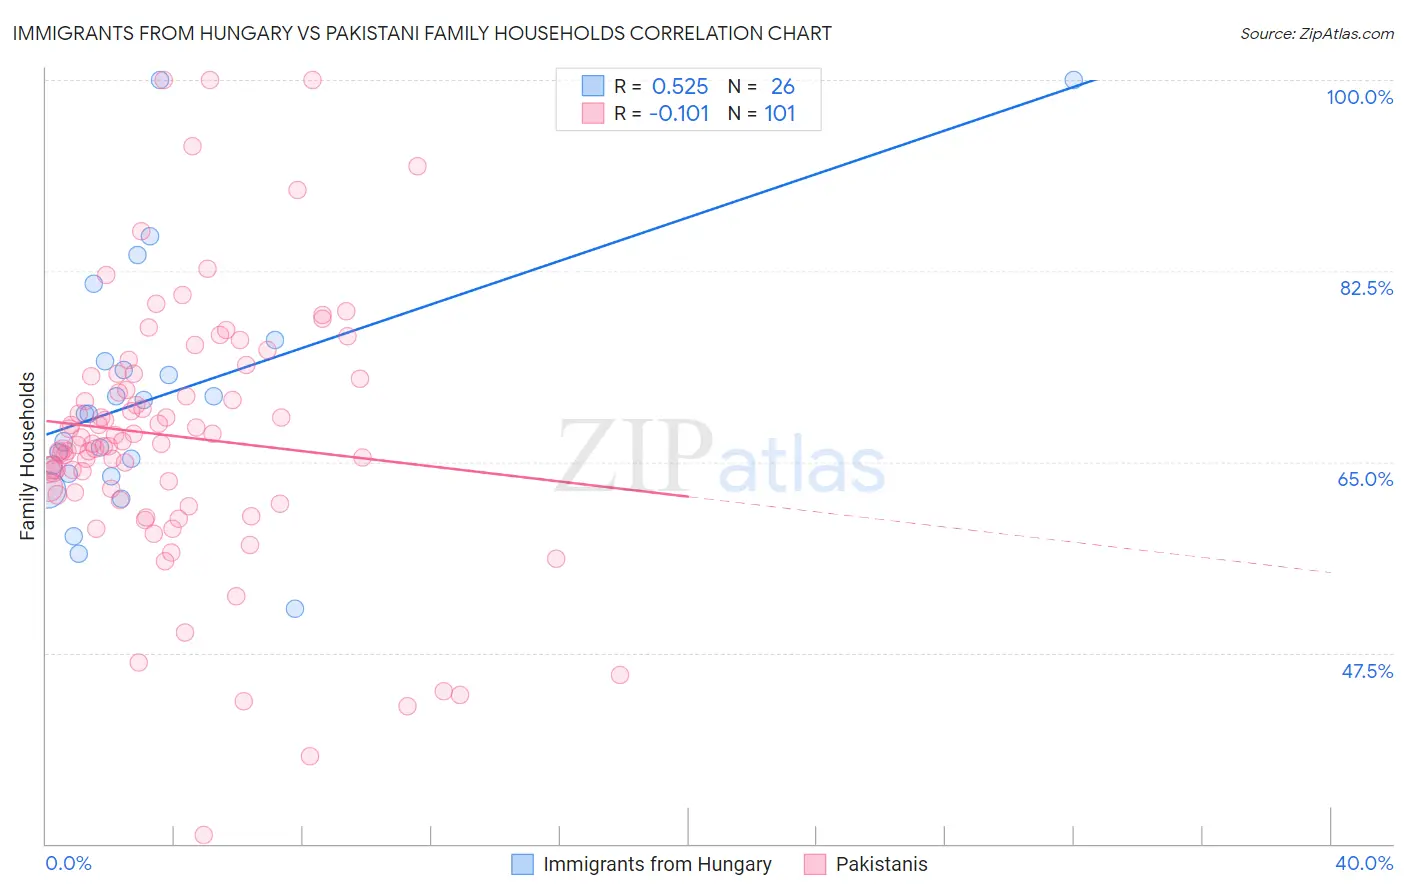
Immigrants from Hungary vs Pakistani Family Households Correlation Chart
The statistical analysis conducted on geographies consisting of 195,664,672 people shows a substantial positive correlation between the proportion of Immigrants from Hungary and percentage of family households in the United States with a correlation coefficient (R) of 0.525 and weighted average of 63.6%. Similarly, the statistical analysis conducted on geographies consisting of 335,180,363 people shows a poor negative correlation between the proportion of Pakistanis and percentage of family households in the United States with a correlation coefficient (R) of -0.101 and weighted average of 64.7%, a difference of 1.6%.
Family Households Correlation Summary
| Measurement | Immigrants from Hungary | Pakistani |
| Minimum | 51.6% | 30.8% |
| Maximum | 100.0% | 100.0% |
| Range | 48.4% | 69.2% |
| Mean | 71.0% | 67.3% |
| Median | 69.4% | 66.7% |
| Interquartile 25% (IQ1) | 63.9% | 62.1% |
| Interquartile 75% (IQ3) | 74.2% | 73.0% |
| Interquartile Range (IQR) | 10.3% | 10.9% |
| Standard Deviation (Sample) | 11.6% | 12.1% |
| Standard Deviation (Population) | 11.4% | 12.0% |
Similar Demographics by Family Households
Demographics Similar to Immigrants from Hungary by Family Households
In terms of family households, the demographic groups most similar to Immigrants from Hungary are Turkish (63.6%, a difference of 0.010%), Immigrants from Bahamas (63.6%, a difference of 0.010%), Trinidadian and Tobagonian (63.6%, a difference of 0.020%), Blackfeet (63.6%, a difference of 0.070%), and French Canadian (63.7%, a difference of 0.080%).
| Demographics | Rating | Rank | Family Households |
| Marshallese | 6.9 /100 | #218 | Tragic 63.7% |
| Macedonians | 6.5 /100 | #219 | Tragic 63.7% |
| Immigrants | Europe | 6.4 /100 | #220 | Tragic 63.7% |
| Immigrants | South Africa | 5.9 /100 | #221 | Tragic 63.7% |
| Immigrants | Belarus | 5.5 /100 | #222 | Tragic 63.7% |
| French Canadians | 5.4 /100 | #223 | Tragic 63.7% |
| Turks | 4.5 /100 | #224 | Tragic 63.6% |
| Immigrants | Hungary | 4.3 /100 | #225 | Tragic 63.6% |
| Immigrants | Bahamas | 4.2 /100 | #226 | Tragic 63.6% |
| Trinidadians and Tobagonians | 4.1 /100 | #227 | Tragic 63.6% |
| Blackfeet | 3.6 /100 | #228 | Tragic 63.6% |
| Bulgarians | 3.4 /100 | #229 | Tragic 63.6% |
| Immigrants | Brazil | 3.0 /100 | #230 | Tragic 63.6% |
| Immigrants | Greece | 2.9 /100 | #231 | Tragic 63.5% |
| Immigrants | Northern Africa | 2.6 /100 | #232 | Tragic 63.5% |
Demographics Similar to Pakistanis by Family Households
In terms of family households, the demographic groups most similar to Pakistanis are Immigrants from North Macedonia (64.7%, a difference of 0.020%), Immigrants from Cameroon (64.7%, a difference of 0.020%), Immigrants from Jamaica (64.7%, a difference of 0.030%), Basque (64.7%, a difference of 0.040%), and Czechoslovakian (64.6%, a difference of 0.050%).
| Demographics | Rating | Rank | Family Households |
| Maltese | 87.4 /100 | #135 | Excellent 64.7% |
| Immigrants | China | 86.6 /100 | #136 | Excellent 64.7% |
| Immigrants | Scotland | 86.4 /100 | #137 | Excellent 64.7% |
| Basques | 85.5 /100 | #138 | Excellent 64.7% |
| Immigrants | Jamaica | 85.3 /100 | #139 | Excellent 64.7% |
| Immigrants | North Macedonia | 84.9 /100 | #140 | Excellent 64.7% |
| Immigrants | Cameroon | 84.8 /100 | #141 | Excellent 64.7% |
| Pakistanis | 84.0 /100 | #142 | Excellent 64.7% |
| Czechoslovakians | 82.1 /100 | #143 | Excellent 64.6% |
| South American Indians | 81.9 /100 | #144 | Excellent 64.6% |
| Welsh | 80.1 /100 | #145 | Excellent 64.6% |
| Immigrants | Romania | 77.0 /100 | #146 | Good 64.6% |
| Immigrants | Chile | 76.5 /100 | #147 | Good 64.6% |
| Delaware | 76.3 /100 | #148 | Good 64.6% |
| Sioux | 76.3 /100 | #149 | Good 64.6% |