Immigrants from Thailand vs Subsaharan African Disability Age 18 to 34
COMPARE
Immigrants from Thailand
Subsaharan African
Disability Age 18 to 34
Disability Age 18 to 34 Comparison
Immigrants from Thailand
Sub-Saharan Africans
6.9%
DISABILITY AGE 18 TO 34
7.5/ 100
METRIC RATING
215th/ 347
METRIC RANK
7.1%
DISABILITY AGE 18 TO 34
1.7/ 100
METRIC RATING
235th/ 347
METRIC RANK
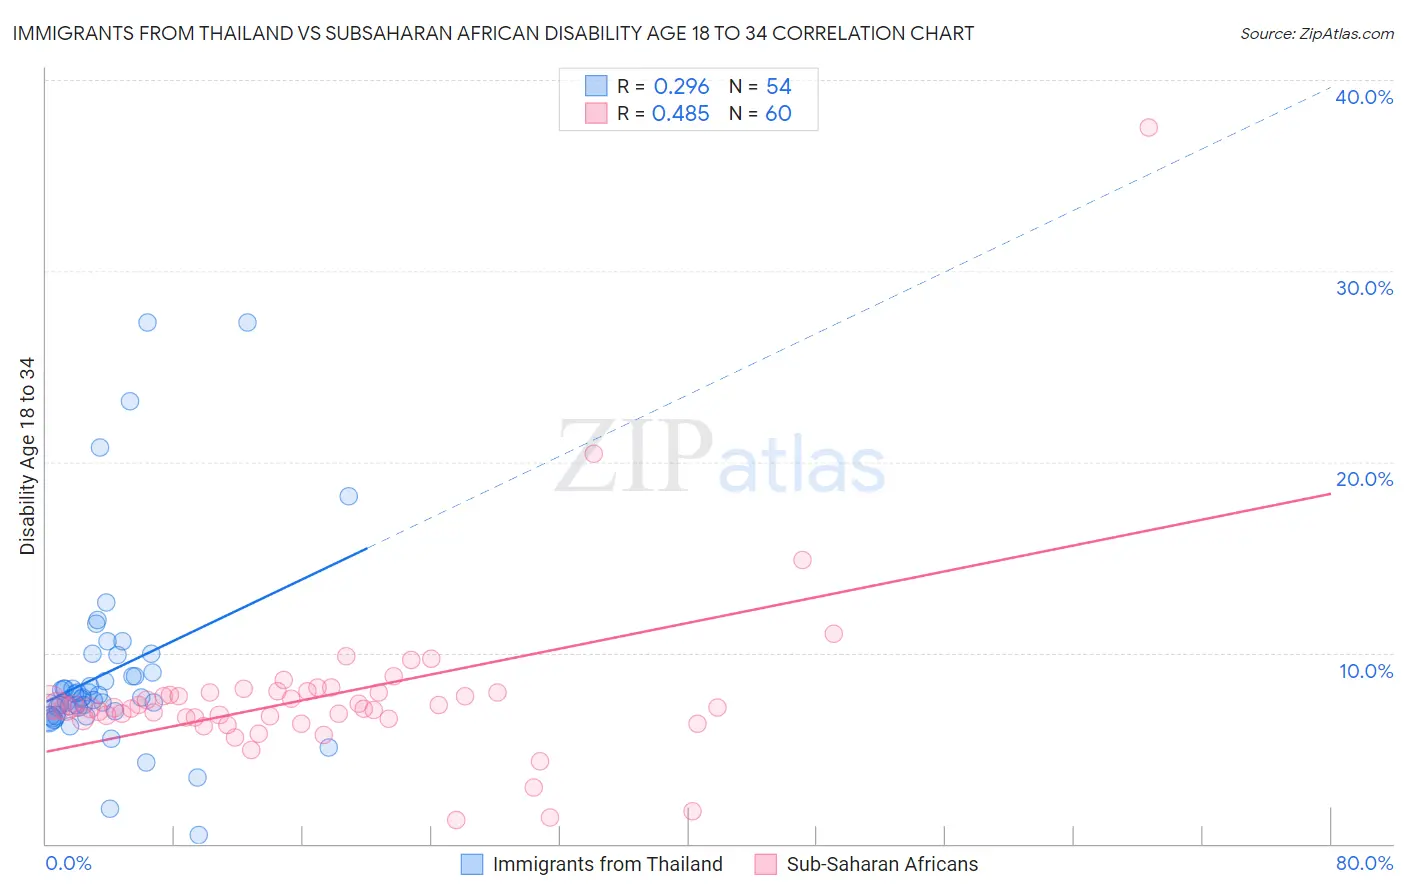
Immigrants from Thailand vs Subsaharan African Disability Age 18 to 34 Correlation Chart
The statistical analysis conducted on geographies consisting of 316,632,491 people shows a weak positive correlation between the proportion of Immigrants from Thailand and percentage of population with a disability between the ages 18 and 35 in the United States with a correlation coefficient (R) of 0.296 and weighted average of 6.9%. Similarly, the statistical analysis conducted on geographies consisting of 506,334,183 people shows a moderate positive correlation between the proportion of Sub-Saharan Africans and percentage of population with a disability between the ages 18 and 35 in the United States with a correlation coefficient (R) of 0.485 and weighted average of 7.1%, a difference of 2.6%.
Disability Age 18 to 34 Correlation Summary
| Measurement | Immigrants from Thailand | Subsaharan African |
| Minimum | 0.44% | 1.2% |
| Maximum | 27.3% | 37.5% |
| Range | 26.8% | 36.3% |
| Mean | 9.0% | 7.8% |
| Median | 7.7% | 7.1% |
| Interquartile 25% (IQ1) | 6.8% | 6.6% |
| Interquartile 75% (IQ3) | 9.0% | 7.9% |
| Interquartile Range (IQR) | 2.2% | 1.4% |
| Standard Deviation (Sample) | 5.2% | 4.7% |
| Standard Deviation (Population) | 5.1% | 4.7% |
Demographics Similar to Immigrants from Thailand and Sub-Saharan Africans by Disability Age 18 to 34
In terms of disability age 18 to 34, the demographic groups most similar to Immigrants from Thailand are Sudanese (6.9%, a difference of 0.13%), Immigrants from Kenya (6.9%, a difference of 0.15%), Ukrainian (6.9%, a difference of 0.20%), Hawaiian (6.9%, a difference of 0.27%), and Immigrants from Senegal (6.9%, a difference of 0.55%). Similarly, the demographic groups most similar to Sub-Saharan Africans are Alsatian (7.0%, a difference of 0.37%), New Zealander (7.0%, a difference of 0.80%), Samoan (7.0%, a difference of 1.1%), Ute (7.0%, a difference of 1.4%), and Immigrants from North America (7.0%, a difference of 1.4%).
| Demographics | Rating | Rank | Disability Age 18 to 34 |
| Immigrants | Thailand | 7.5 /100 | #215 | Tragic 6.9% |
| Sudanese | 7.0 /100 | #216 | Tragic 6.9% |
| Immigrants | Kenya | 6.9 /100 | #217 | Tragic 6.9% |
| Ukrainians | 6.7 /100 | #218 | Tragic 6.9% |
| Hawaiians | 6.5 /100 | #219 | Tragic 6.9% |
| Immigrants | Senegal | 5.5 /100 | #220 | Tragic 6.9% |
| Immigrants | Middle Africa | 5.5 /100 | #221 | Tragic 6.9% |
| Immigrants | England | 5.3 /100 | #222 | Tragic 6.9% |
| Carpatho Rusyns | 5.2 /100 | #223 | Tragic 6.9% |
| Senegalese | 4.9 /100 | #224 | Tragic 6.9% |
| Central American Indians | 4.7 /100 | #225 | Tragic 6.9% |
| Ugandans | 4.4 /100 | #226 | Tragic 6.9% |
| Immigrants | Canada | 4.3 /100 | #227 | Tragic 7.0% |
| Immigrants | Yemen | 4.2 /100 | #228 | Tragic 7.0% |
| Lithuanians | 4.1 /100 | #229 | Tragic 7.0% |
| Immigrants | North America | 3.9 /100 | #230 | Tragic 7.0% |
| Ute | 3.8 /100 | #231 | Tragic 7.0% |
| Samoans | 3.2 /100 | #232 | Tragic 7.0% |
| New Zealanders | 2.7 /100 | #233 | Tragic 7.0% |
| Alsatians | 2.1 /100 | #234 | Tragic 7.0% |
| Sub-Saharan Africans | 1.7 /100 | #235 | Tragic 7.1% |