Cypriot vs Immigrants from France Currently Married
COMPARE
Cypriot
Immigrants from France
Currently Married
Currently Married Comparison
Cypriots
Immigrants from France
47.8%
CURRENTLY MARRIED
93.7/ 100
METRIC RATING
103rd/ 347
METRIC RANK
46.2%
CURRENTLY MARRIED
27.7/ 100
METRIC RATING
191st/ 347
METRIC RANK
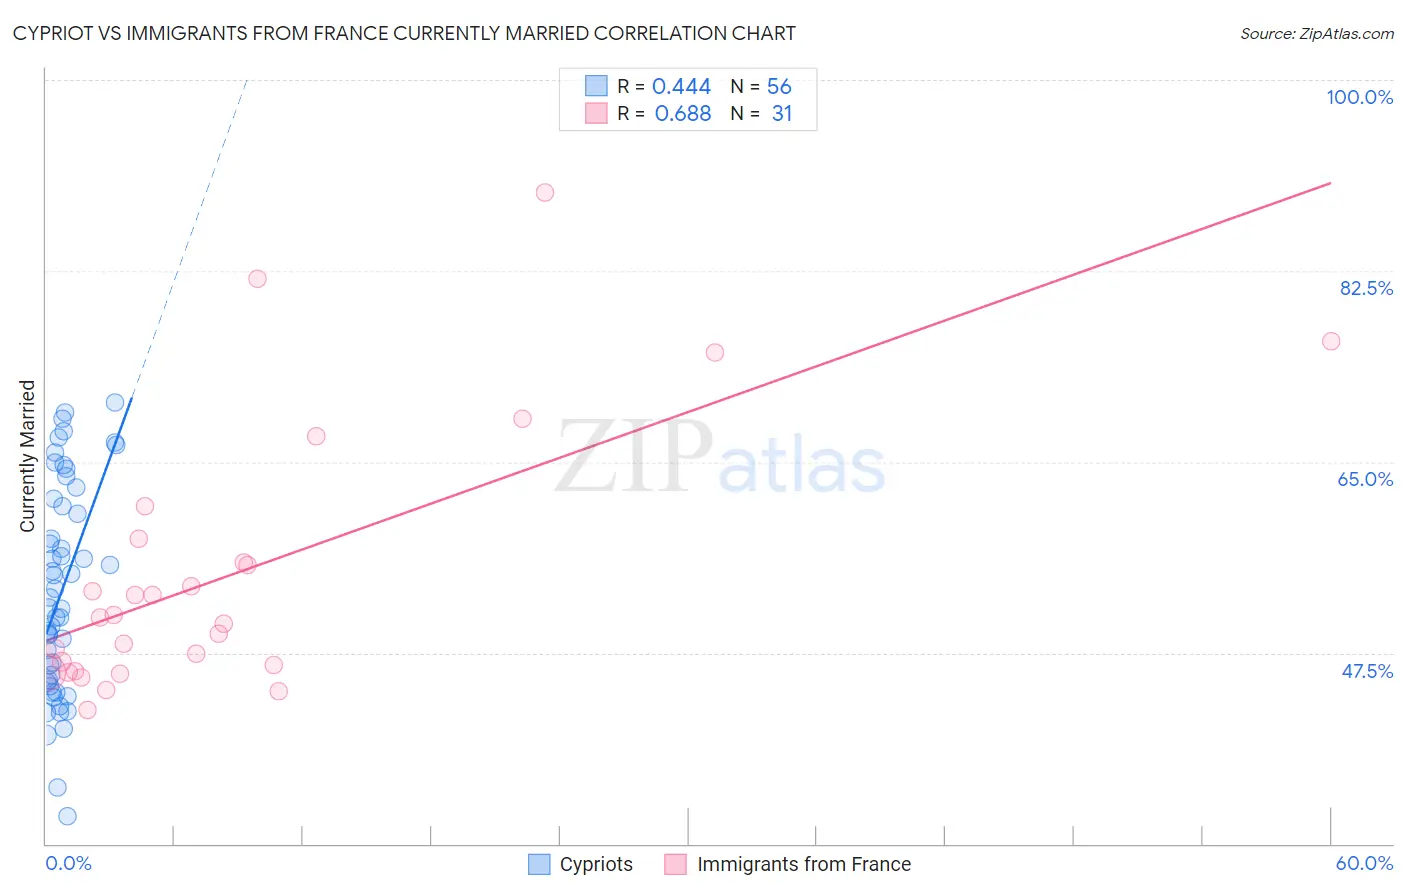
Cypriot vs Immigrants from France Currently Married Correlation Chart
The statistical analysis conducted on geographies consisting of 61,862,826 people shows a moderate positive correlation between the proportion of Cypriots and percentage of population currently married in the United States with a correlation coefficient (R) of 0.444 and weighted average of 47.8%. Similarly, the statistical analysis conducted on geographies consisting of 287,900,584 people shows a significant positive correlation between the proportion of Immigrants from France and percentage of population currently married in the United States with a correlation coefficient (R) of 0.688 and weighted average of 46.2%, a difference of 3.4%.
Currently Married Correlation Summary
| Measurement | Cypriot | Immigrants from France |
| Minimum | 32.6% | 42.2% |
| Maximum | 70.4% | 89.7% |
| Range | 37.8% | 47.5% |
| Mean | 53.2% | 54.8% |
| Median | 52.1% | 50.8% |
| Interquartile 25% (IQ1) | 44.9% | 45.8% |
| Interquartile 75% (IQ3) | 61.3% | 57.9% |
| Interquartile Range (IQR) | 16.4% | 12.1% |
| Standard Deviation (Sample) | 9.6% | 12.1% |
| Standard Deviation (Population) | 9.5% | 11.9% |
Similar Demographics by Currently Married
Demographics Similar to Cypriots by Currently Married
In terms of currently married, the demographic groups most similar to Cypriots are Serbian (47.8%, a difference of 0.020%), Turkish (47.8%, a difference of 0.030%), Immigrants from Germany (47.8%, a difference of 0.050%), Celtic (47.8%, a difference of 0.070%), and Immigrants from Singapore (47.8%, a difference of 0.070%).
| Demographics | Rating | Rank | Currently Married |
| Egyptians | 94.8 /100 | #96 | Exceptional 47.9% |
| Immigrants | Ukraine | 94.8 /100 | #97 | Exceptional 47.9% |
| Immigrants | China | 94.7 /100 | #98 | Exceptional 47.9% |
| Immigrants | Sweden | 94.3 /100 | #99 | Exceptional 47.8% |
| Celtics | 94.2 /100 | #100 | Exceptional 47.8% |
| Immigrants | Germany | 94.1 /100 | #101 | Exceptional 47.8% |
| Turks | 93.9 /100 | #102 | Exceptional 47.8% |
| Cypriots | 93.7 /100 | #103 | Exceptional 47.8% |
| Serbians | 93.6 /100 | #104 | Exceptional 47.8% |
| Immigrants | Singapore | 93.3 /100 | #105 | Exceptional 47.8% |
| Immigrants | Greece | 93.1 /100 | #106 | Exceptional 47.7% |
| Immigrants | Italy | 92.9 /100 | #107 | Exceptional 47.7% |
| Tsimshian | 92.4 /100 | #108 | Exceptional 47.7% |
| Immigrants | Egypt | 92.3 /100 | #109 | Exceptional 47.7% |
| Immigrants | Russia | 92.0 /100 | #110 | Exceptional 47.7% |
Demographics Similar to Immigrants from France by Currently Married
In terms of currently married, the demographic groups most similar to Immigrants from France are Choctaw (46.3%, a difference of 0.060%), Soviet Union (46.2%, a difference of 0.090%), Fijian (46.3%, a difference of 0.12%), Immigrants from Fiji (46.2%, a difference of 0.13%), and Colombian (46.3%, a difference of 0.18%).
| Demographics | Rating | Rank | Currently Married |
| Brazilians | 39.3 /100 | #184 | Fair 46.4% |
| Mongolians | 37.6 /100 | #185 | Fair 46.4% |
| Immigrants | Chile | 36.8 /100 | #186 | Fair 46.4% |
| Immigrants | Peru | 35.3 /100 | #187 | Fair 46.4% |
| Colombians | 31.8 /100 | #188 | Fair 46.3% |
| Fijians | 30.3 /100 | #189 | Fair 46.3% |
| Choctaw | 29.1 /100 | #190 | Fair 46.3% |
| Immigrants | France | 27.7 /100 | #191 | Fair 46.2% |
| Soviet Union | 25.7 /100 | #192 | Fair 46.2% |
| Immigrants | Fiji | 25.0 /100 | #193 | Fair 46.2% |
| South Americans | 23.8 /100 | #194 | Fair 46.1% |
| Immigrants | Nepal | 23.7 /100 | #195 | Fair 46.1% |
| Immigrants | Bosnia and Herzegovina | 22.2 /100 | #196 | Fair 46.1% |
| Immigrants | Kuwait | 21.7 /100 | #197 | Fair 46.1% |
| Immigrants | Colombia | 21.0 /100 | #198 | Fair 46.1% |