Choctaw vs European Single Mother Households
COMPARE
Choctaw
European
Single Mother Households
Single Mother Households Comparison
Choctaw
Europeans
7.0%
SINGLE MOTHER HOUSEHOLDS
1.4/ 100
METRIC RATING
233rd/ 347
METRIC RANK
5.7%
SINGLE MOTHER HOUSEHOLDS
97.0/ 100
METRIC RATING
91st/ 347
METRIC RANK
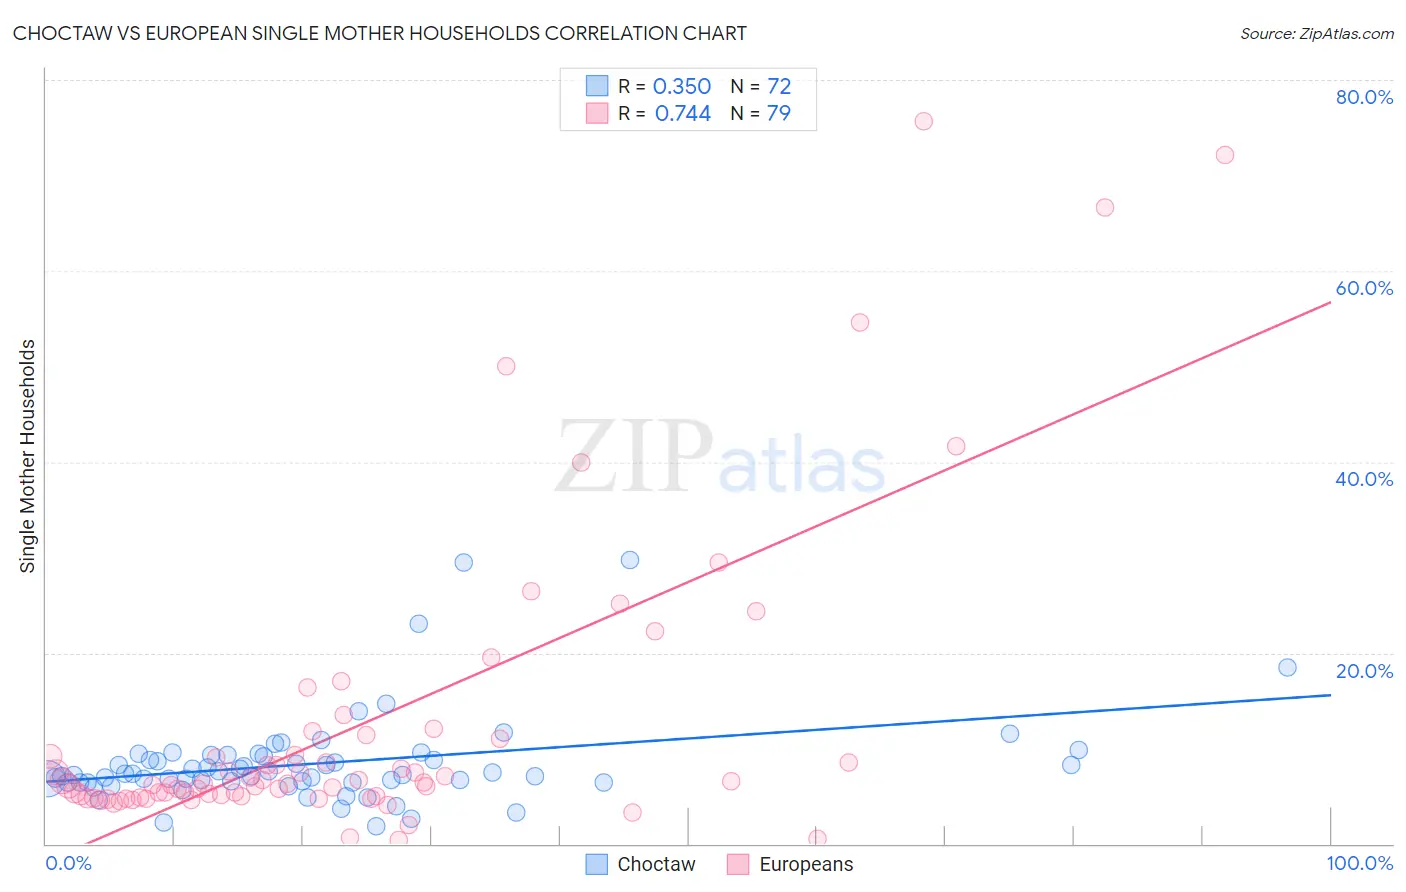
Choctaw vs European Single Mother Households Correlation Chart
The statistical analysis conducted on geographies consisting of 269,186,526 people shows a mild positive correlation between the proportion of Choctaw and percentage of single mother households in the United States with a correlation coefficient (R) of 0.350 and weighted average of 7.0%. Similarly, the statistical analysis conducted on geographies consisting of 557,141,614 people shows a strong positive correlation between the proportion of Europeans and percentage of single mother households in the United States with a correlation coefficient (R) of 0.744 and weighted average of 5.7%, a difference of 23.3%.
Single Mother Households Correlation Summary
| Measurement | Choctaw | European |
| Minimum | 1.9% | 0.36% |
| Maximum | 29.7% | 75.7% |
| Range | 27.9% | 75.3% |
| Mean | 8.4% | 12.4% |
| Median | 7.3% | 6.3% |
| Interquartile 25% (IQ1) | 6.5% | 5.0% |
| Interquartile 75% (IQ3) | 9.2% | 11.1% |
| Interquartile Range (IQR) | 2.8% | 6.1% |
| Standard Deviation (Sample) | 4.8% | 15.7% |
| Standard Deviation (Population) | 4.8% | 15.6% |
Similar Demographics by Single Mother Households
Demographics Similar to Choctaw by Single Mother Households
In terms of single mother households, the demographic groups most similar to Choctaw are Chickasaw (7.0%, a difference of 0.020%), Immigrants from Burma/Myanmar (7.0%, a difference of 0.090%), Comanche (7.0%, a difference of 0.17%), Spanish American (7.0%, a difference of 0.23%), and Creek (7.0%, a difference of 0.25%).
| Demographics | Rating | Rank | Single Mother Households |
| Paiute | 2.4 /100 | #226 | Tragic 7.0% |
| Kenyans | 2.3 /100 | #227 | Tragic 7.0% |
| Iroquois | 2.2 /100 | #228 | Tragic 7.0% |
| Immigrants | Kenya | 2.1 /100 | #229 | Tragic 7.0% |
| Creek | 1.6 /100 | #230 | Tragic 7.0% |
| Spanish Americans | 1.6 /100 | #231 | Tragic 7.0% |
| Comanche | 1.5 /100 | #232 | Tragic 7.0% |
| Choctaw | 1.4 /100 | #233 | Tragic 7.0% |
| Chickasaw | 1.4 /100 | #234 | Tragic 7.0% |
| Immigrants | Burma/Myanmar | 1.4 /100 | #235 | Tragic 7.0% |
| Ute | 1.0 /100 | #236 | Tragic 7.1% |
| Arapaho | 1.0 /100 | #237 | Tragic 7.1% |
| Panamanians | 0.9 /100 | #238 | Tragic 7.1% |
| Kiowa | 0.8 /100 | #239 | Tragic 7.1% |
| Immigrants | Panama | 0.7 /100 | #240 | Tragic 7.2% |
Demographics Similar to Europeans by Single Mother Households
In terms of single mother households, the demographic groups most similar to Europeans are Immigrants from Indonesia (5.7%, a difference of 0.22%), Immigrants from Western Asia (5.7%, a difference of 0.23%), Serbian (5.7%, a difference of 0.24%), Ukrainian (5.7%, a difference of 0.28%), and Basque (5.7%, a difference of 0.29%).
| Demographics | Rating | Rank | Single Mother Households |
| Carpatho Rusyns | 97.7 /100 | #84 | Exceptional 5.7% |
| Hungarians | 97.6 /100 | #85 | Exceptional 5.7% |
| Finns | 97.6 /100 | #86 | Exceptional 5.7% |
| Immigrants | Turkey | 97.5 /100 | #87 | Exceptional 5.7% |
| Israelis | 97.4 /100 | #88 | Exceptional 5.7% |
| Ukrainians | 97.2 /100 | #89 | Exceptional 5.7% |
| Immigrants | Indonesia | 97.2 /100 | #90 | Exceptional 5.7% |
| Europeans | 97.0 /100 | #91 | Exceptional 5.7% |
| Immigrants | Western Asia | 96.7 /100 | #92 | Exceptional 5.7% |
| Serbians | 96.7 /100 | #93 | Exceptional 5.7% |
| Basques | 96.7 /100 | #94 | Exceptional 5.7% |
| Slovaks | 96.6 /100 | #95 | Exceptional 5.7% |
| Austrians | 96.4 /100 | #96 | Exceptional 5.7% |
| Tlingit-Haida | 96.4 /100 | #97 | Exceptional 5.7% |
| Immigrants | South Africa | 96.3 /100 | #98 | Exceptional 5.7% |