Carpatho Rusyn vs European Single Mother Households
COMPARE
Carpatho Rusyn
European
Single Mother Households
Single Mother Households Comparison
Carpatho Rusyns
Europeans
5.7%
SINGLE MOTHER HOUSEHOLDS
97.7/ 100
METRIC RATING
84th/ 347
METRIC RANK
5.7%
SINGLE MOTHER HOUSEHOLDS
97.0/ 100
METRIC RATING
91st/ 347
METRIC RANK
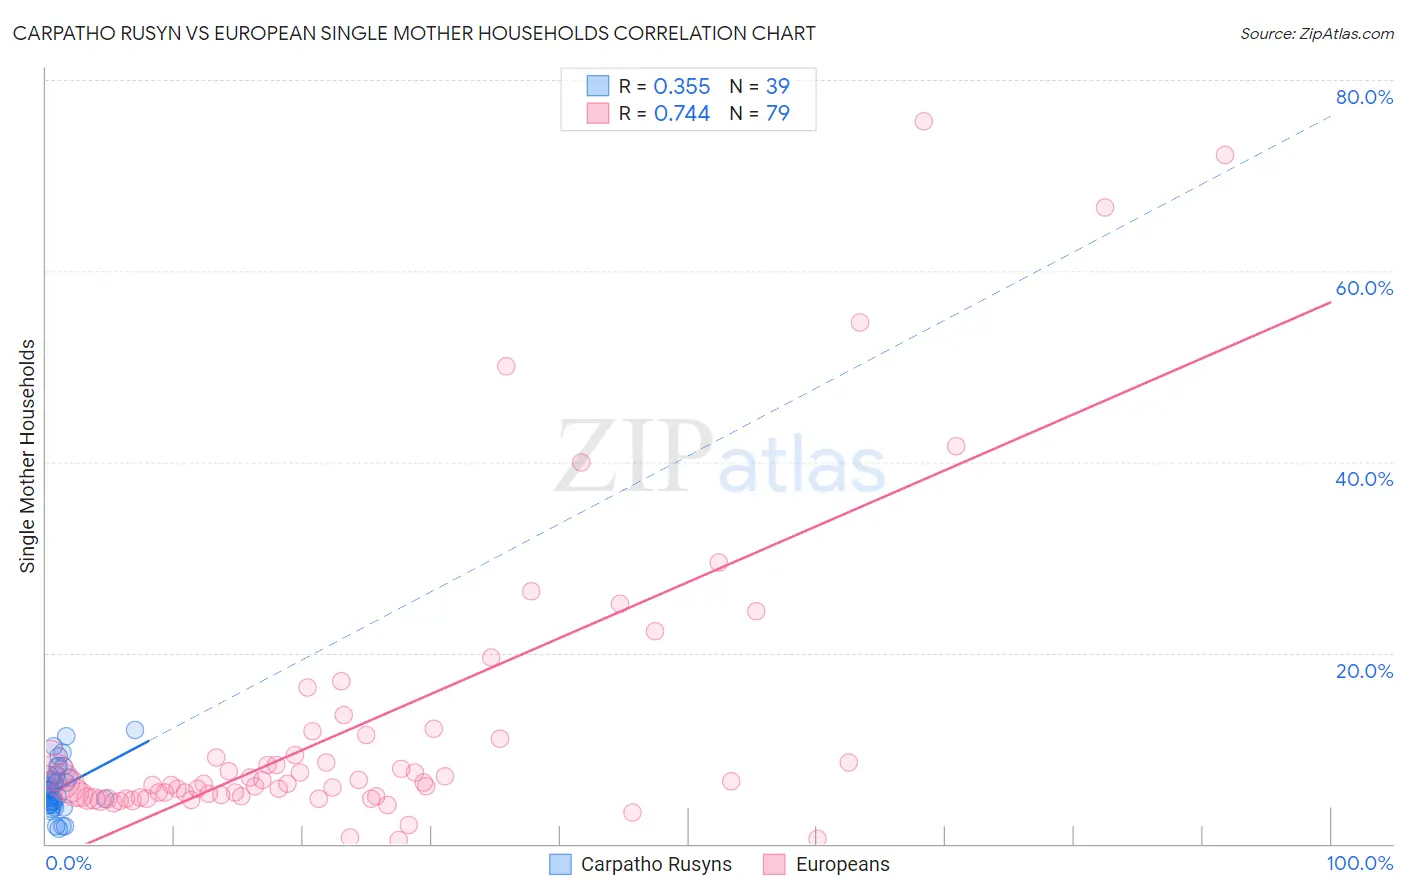
Carpatho Rusyn vs European Single Mother Households Correlation Chart
The statistical analysis conducted on geographies consisting of 58,858,752 people shows a mild positive correlation between the proportion of Carpatho Rusyns and percentage of single mother households in the United States with a correlation coefficient (R) of 0.355 and weighted average of 5.7%. Similarly, the statistical analysis conducted on geographies consisting of 557,141,614 people shows a strong positive correlation between the proportion of Europeans and percentage of single mother households in the United States with a correlation coefficient (R) of 0.744 and weighted average of 5.7%, a difference of 0.88%.
Single Mother Households Correlation Summary
| Measurement | Carpatho Rusyn | European |
| Minimum | 1.5% | 0.36% |
| Maximum | 11.9% | 75.7% |
| Range | 10.4% | 75.3% |
| Mean | 5.8% | 12.4% |
| Median | 5.6% | 6.3% |
| Interquartile 25% (IQ1) | 4.1% | 5.0% |
| Interquartile 75% (IQ3) | 6.9% | 11.1% |
| Interquartile Range (IQR) | 2.8% | 6.1% |
| Standard Deviation (Sample) | 2.5% | 15.7% |
| Standard Deviation (Population) | 2.5% | 15.6% |
Demographics Similar to Carpatho Rusyns and Europeans by Single Mother Households
In terms of single mother households, the demographic groups most similar to Carpatho Rusyns are Immigrants from Hungary (5.7%, a difference of 0.080%), Immigrants from Malaysia (5.7%, a difference of 0.10%), Hungarian (5.7%, a difference of 0.15%), Finnish (5.7%, a difference of 0.18%), and Immigrants from Turkey (5.7%, a difference of 0.26%). Similarly, the demographic groups most similar to Europeans are Immigrants from Indonesia (5.7%, a difference of 0.22%), Immigrants from Western Asia (5.7%, a difference of 0.23%), Serbian (5.7%, a difference of 0.24%), Ukrainian (5.7%, a difference of 0.28%), and Basque (5.7%, a difference of 0.29%).
| Demographics | Rating | Rank | Single Mother Households |
| Romanians | 98.1 /100 | #77 | Exceptional 5.6% |
| Swiss | 98.1 /100 | #78 | Exceptional 5.6% |
| Immigrants | Sri Lanka | 98.0 /100 | #79 | Exceptional 5.6% |
| Czechs | 97.9 /100 | #80 | Exceptional 5.6% |
| Immigrants | Moldova | 97.9 /100 | #81 | Exceptional 5.6% |
| Immigrants | Malaysia | 97.8 /100 | #82 | Exceptional 5.7% |
| Immigrants | Hungary | 97.8 /100 | #83 | Exceptional 5.7% |
| Carpatho Rusyns | 97.7 /100 | #84 | Exceptional 5.7% |
| Hungarians | 97.6 /100 | #85 | Exceptional 5.7% |
| Finns | 97.6 /100 | #86 | Exceptional 5.7% |
| Immigrants | Turkey | 97.5 /100 | #87 | Exceptional 5.7% |
| Israelis | 97.4 /100 | #88 | Exceptional 5.7% |
| Ukrainians | 97.2 /100 | #89 | Exceptional 5.7% |
| Immigrants | Indonesia | 97.2 /100 | #90 | Exceptional 5.7% |
| Europeans | 97.0 /100 | #91 | Exceptional 5.7% |
| Immigrants | Western Asia | 96.7 /100 | #92 | Exceptional 5.7% |
| Serbians | 96.7 /100 | #93 | Exceptional 5.7% |
| Basques | 96.7 /100 | #94 | Exceptional 5.7% |
| Slovaks | 96.6 /100 | #95 | Exceptional 5.7% |
| Austrians | 96.4 /100 | #96 | Exceptional 5.7% |
| Tlingit-Haida | 96.4 /100 | #97 | Exceptional 5.7% |