Immigrants from Taiwan vs Norwegian Single Father Households
COMPARE
Immigrants from Taiwan
Norwegian
Single Father Households
Single Father Households Comparison
Immigrants from Taiwan
Norwegians
1.8%
SINGLE FATHER HOUSEHOLDS
100.0/ 100
METRIC RATING
6th/ 347
METRIC RANK
2.4%
SINGLE FATHER HOUSEHOLDS
17.1/ 100
METRIC RATING
213th/ 347
METRIC RANK
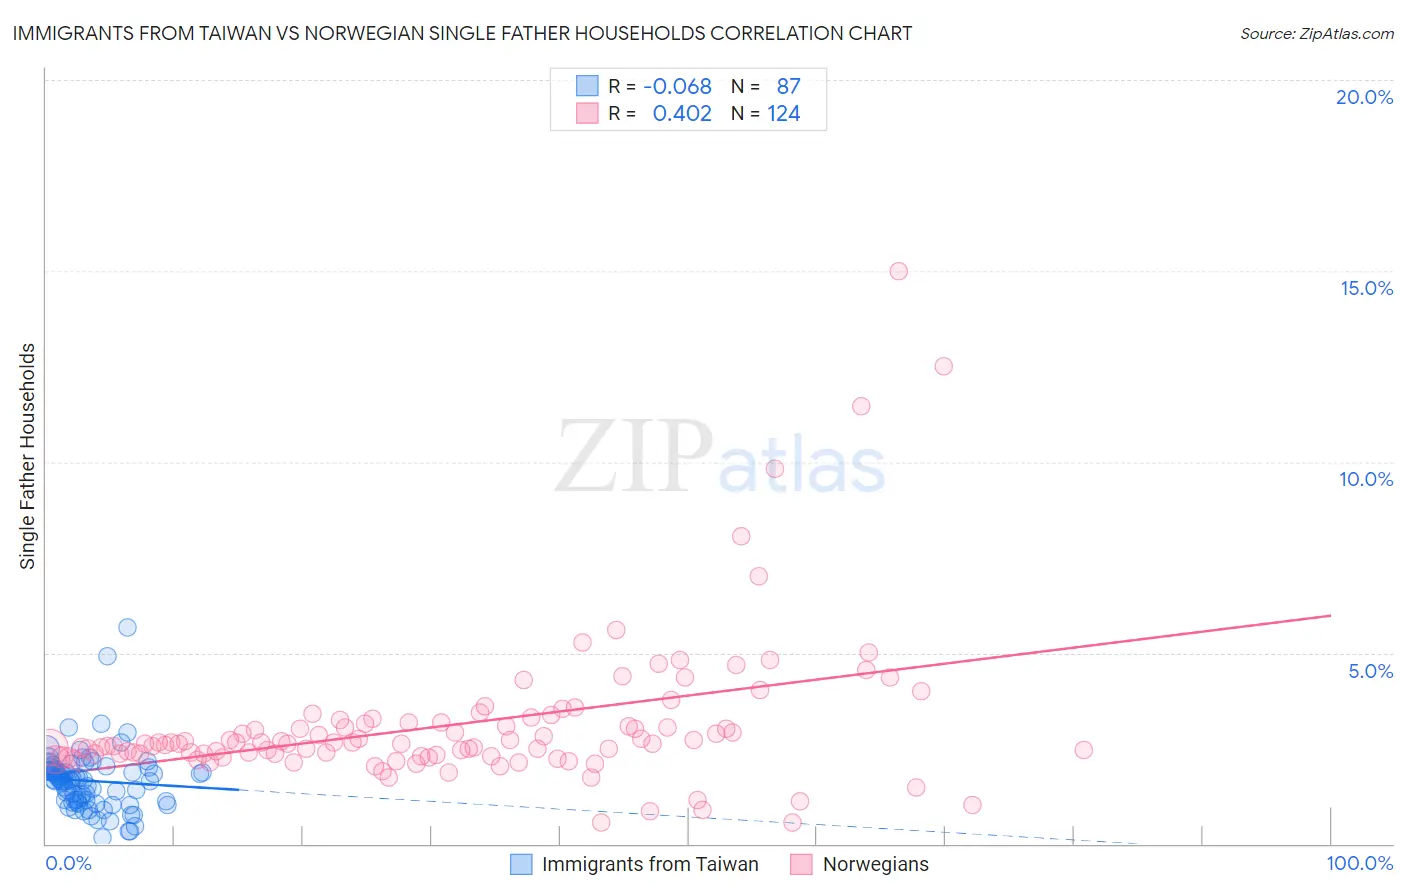
Immigrants from Taiwan vs Norwegian Single Father Households Correlation Chart
The statistical analysis conducted on geographies consisting of 296,358,565 people shows a slight negative correlation between the proportion of Immigrants from Taiwan and percentage of single father households in the United States with a correlation coefficient (R) of -0.068 and weighted average of 1.8%. Similarly, the statistical analysis conducted on geographies consisting of 522,435,304 people shows a moderate positive correlation between the proportion of Norwegians and percentage of single father households in the United States with a correlation coefficient (R) of 0.402 and weighted average of 2.4%, a difference of 30.8%.
Single Father Households Correlation Summary
| Measurement | Immigrants from Taiwan | Norwegian |
| Minimum | 0.15% | 0.55% |
| Maximum | 5.7% | 15.0% |
| Range | 5.5% | 14.5% |
| Mean | 1.6% | 3.1% |
| Median | 1.7% | 2.6% |
| Interquartile 25% (IQ1) | 1.1% | 2.3% |
| Interquartile 75% (IQ3) | 1.9% | 3.2% |
| Interquartile Range (IQR) | 0.84% | 0.86% |
| Standard Deviation (Sample) | 0.82% | 2.0% |
| Standard Deviation (Population) | 0.82% | 2.0% |
Similar Demographics by Single Father Households
Demographics Similar to Immigrants from Taiwan by Single Father Households
In terms of single father households, the demographic groups most similar to Immigrants from Taiwan are Cypriot (1.8%, a difference of 0.16%), Immigrants from Ireland (1.8%, a difference of 0.27%), Immigrants from Hong Kong (1.8%, a difference of 0.37%), Immigrants from China (1.8%, a difference of 0.40%), and Okinawan (1.9%, a difference of 0.76%).
| Demographics | Rating | Rank | Single Father Households |
| Soviet Union | 100.0 /100 | #1 | Exceptional 1.8% |
| Immigrants | Israel | 100.0 /100 | #2 | Exceptional 1.8% |
| Filipinos | 100.0 /100 | #3 | Exceptional 1.8% |
| Immigrants | Uzbekistan | 100.0 /100 | #4 | Exceptional 1.8% |
| Immigrants | Hong Kong | 100.0 /100 | #5 | Exceptional 1.8% |
| Immigrants | Taiwan | 100.0 /100 | #6 | Exceptional 1.8% |
| Cypriots | 100.0 /100 | #7 | Exceptional 1.8% |
| Immigrants | Ireland | 100.0 /100 | #8 | Exceptional 1.8% |
| Immigrants | China | 100.0 /100 | #9 | Exceptional 1.8% |
| Okinawans | 100.0 /100 | #10 | Exceptional 1.9% |
| Immigrants | Belarus | 100.0 /100 | #11 | Exceptional 1.9% |
| Immigrants | Greece | 100.0 /100 | #12 | Exceptional 1.9% |
| Immigrants | Singapore | 100.0 /100 | #13 | Exceptional 1.9% |
| Immigrants | Lithuania | 100.0 /100 | #14 | Exceptional 1.9% |
| Immigrants | Eastern Asia | 100.0 /100 | #15 | Exceptional 1.9% |
Demographics Similar to Norwegians by Single Father Households
In terms of single father households, the demographic groups most similar to Norwegians are Ethiopian (2.4%, a difference of 0.060%), Finnish (2.4%, a difference of 0.15%), Immigrants from South Eastern Asia (2.4%, a difference of 0.16%), Immigrants from Nigeria (2.4%, a difference of 0.20%), and Immigrants from Costa Rica (2.4%, a difference of 0.25%).
| Demographics | Rating | Rank | Single Father Households |
| Koreans | 24.1 /100 | #206 | Fair 2.4% |
| Whites/Caucasians | 22.6 /100 | #207 | Fair 2.4% |
| Immigrants | Kenya | 20.3 /100 | #208 | Fair 2.4% |
| Immigrants | Peru | 19.3 /100 | #209 | Poor 2.4% |
| Immigrants | Costa Rica | 19.2 /100 | #210 | Poor 2.4% |
| Immigrants | Nigeria | 18.7 /100 | #211 | Poor 2.4% |
| Finns | 18.3 /100 | #212 | Poor 2.4% |
| Norwegians | 17.1 /100 | #213 | Poor 2.4% |
| Ethiopians | 16.6 /100 | #214 | Poor 2.4% |
| Immigrants | South Eastern Asia | 15.9 /100 | #215 | Poor 2.4% |
| Immigrants | Ecuador | 14.9 /100 | #216 | Poor 2.4% |
| Dutch | 14.3 /100 | #217 | Poor 2.4% |
| Immigrants | Ethiopia | 13.4 /100 | #218 | Poor 2.4% |
| Sudanese | 13.0 /100 | #219 | Poor 2.4% |
| Ghanaians | 12.9 /100 | #220 | Poor 2.4% |