Immigrants from Switzerland vs Iroquois Family Households with Children
COMPARE
Immigrants from Switzerland
Iroquois
Family Households with Children
Family Households with Children Comparison
Immigrants from Switzerland
Iroquois
25.7%
FAMILY HOUSEHOLDS WITH CHILDREN
0.0/ 100
METRIC RATING
333rd/ 347
METRIC RANK
26.1%
FAMILY HOUSEHOLDS WITH CHILDREN
0.0/ 100
METRIC RATING
318th/ 347
METRIC RANK
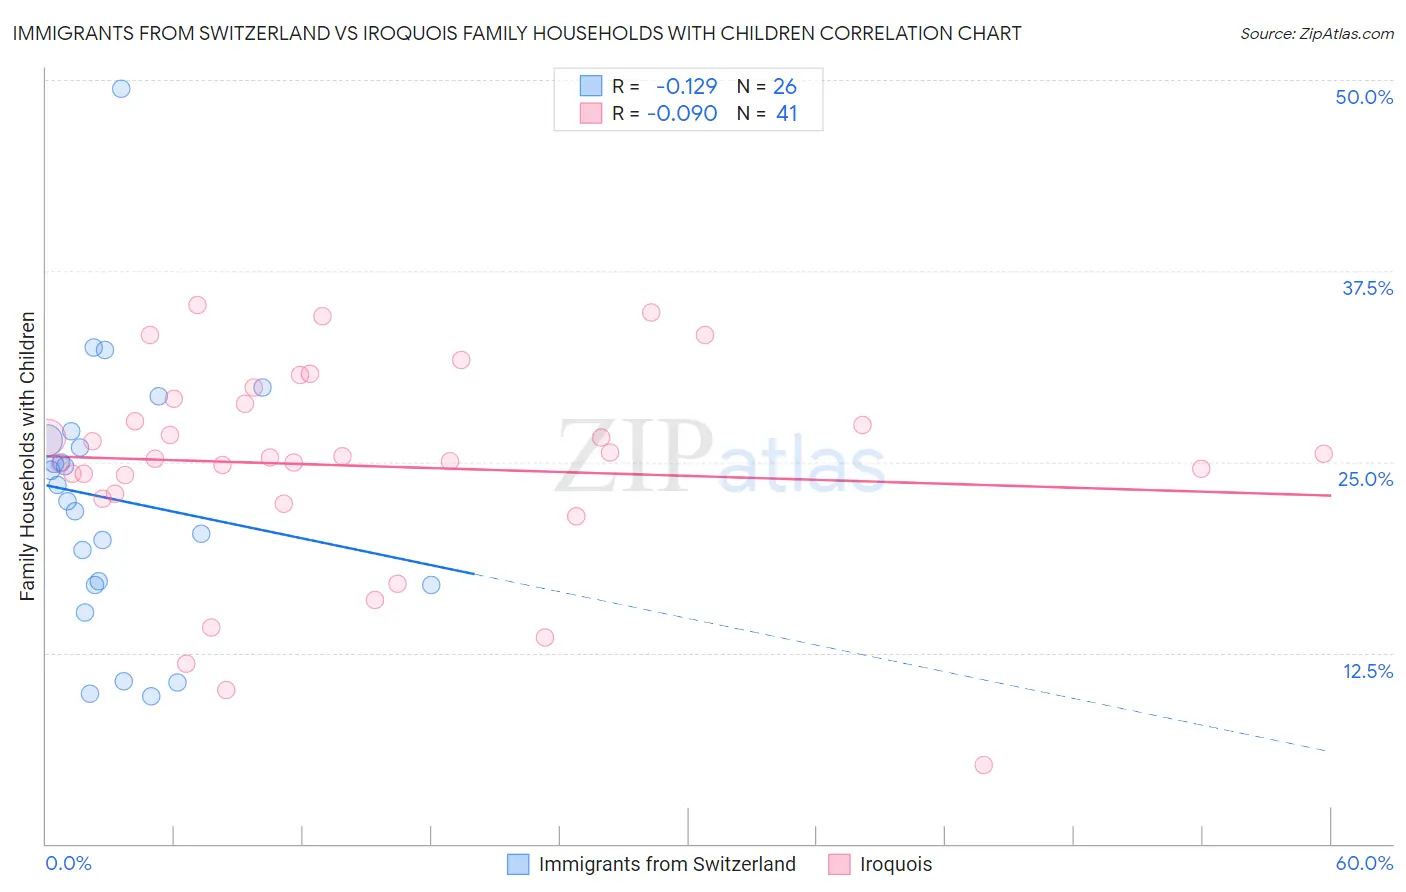
Immigrants from Switzerland vs Iroquois Family Households with Children Correlation Chart
The statistical analysis conducted on geographies consisting of 148,054,749 people shows a poor negative correlation between the proportion of Immigrants from Switzerland and percentage of family households with children in the United States with a correlation coefficient (R) of -0.129 and weighted average of 25.7%. Similarly, the statistical analysis conducted on geographies consisting of 207,224,284 people shows a slight negative correlation between the proportion of Iroquois and percentage of family households with children in the United States with a correlation coefficient (R) of -0.090 and weighted average of 26.1%, a difference of 1.2%.
Family Households with Children Correlation Summary
| Measurement | Immigrants from Switzerland | Iroquois |
| Minimum | 9.6% | 5.2% |
| Maximum | 49.4% | 35.2% |
| Range | 39.8% | 30.1% |
| Mean | 22.5% | 24.7% |
| Median | 22.9% | 25.3% |
| Interquartile 25% (IQ1) | 17.0% | 22.7% |
| Interquartile 75% (IQ3) | 26.4% | 29.0% |
| Interquartile Range (IQR) | 9.5% | 6.2% |
| Standard Deviation (Sample) | 8.6% | 6.8% |
| Standard Deviation (Population) | 8.5% | 6.7% |
Demographics Similar to Immigrants from Switzerland and Iroquois by Family Households with Children
In terms of family households with children, the demographic groups most similar to Immigrants from Switzerland are Immigrants from Austria (25.8%, a difference of 0.080%), Slovak (25.7%, a difference of 0.15%), Immigrants from Croatia (25.7%, a difference of 0.16%), Slovene (25.8%, a difference of 0.31%), and Immigrants from Latvia (25.9%, a difference of 0.44%). Similarly, the demographic groups most similar to Iroquois are Ottawa (26.1%, a difference of 0.050%), Immigrants from France (26.0%, a difference of 0.090%), Tlingit-Haida (26.0%, a difference of 0.10%), British West Indian (26.0%, a difference of 0.12%), and Estonian (26.1%, a difference of 0.13%).
| Demographics | Rating | Rank | Family Households with Children |
| Immigrants | Norway | 0.0 /100 | #315 | Tragic 26.1% |
| Estonians | 0.0 /100 | #316 | Tragic 26.1% |
| Ottawa | 0.0 /100 | #317 | Tragic 26.1% |
| Iroquois | 0.0 /100 | #318 | Tragic 26.1% |
| Immigrants | France | 0.0 /100 | #319 | Tragic 26.0% |
| Tlingit-Haida | 0.0 /100 | #320 | Tragic 26.0% |
| British West Indians | 0.0 /100 | #321 | Tragic 26.0% |
| Immigrants | Greece | 0.0 /100 | #322 | Tragic 26.0% |
| Immigrants | Australia | 0.0 /100 | #323 | Tragic 26.0% |
| Chinese | 0.0 /100 | #324 | Tragic 26.0% |
| Barbadians | 0.0 /100 | #325 | Tragic 26.0% |
| Immigrants | Ireland | 0.0 /100 | #326 | Tragic 26.0% |
| Immigrants | Barbados | 0.0 /100 | #327 | Tragic 26.0% |
| Immigrants | Albania | 0.0 /100 | #328 | Tragic 25.9% |
| Cypriots | 0.0 /100 | #329 | Tragic 25.9% |
| Immigrants | Latvia | 0.0 /100 | #330 | Tragic 25.9% |
| Slovenes | 0.0 /100 | #331 | Tragic 25.8% |
| Immigrants | Austria | 0.0 /100 | #332 | Tragic 25.8% |
| Immigrants | Switzerland | 0.0 /100 | #333 | Tragic 25.7% |
| Slovaks | 0.0 /100 | #334 | Tragic 25.7% |
| Immigrants | Croatia | 0.0 /100 | #335 | Tragic 25.7% |